Wingtip Vortex structure in Swept-tapered wings
 Richard Green ✉
Hossein Zare-Behtash
Richard Green ✉
Hossein Zare-Behtash
Affiliation : University of Glasgow, University Avenue, G12 8QQ, Glasgow, Scotland, UK
✉ Richard.Green@glasgow.ac.uk; admin@nwtf.ac.uk
Introduction:
Induced drag associated with the wing wake remains a critical concern for the aviation industry. In addition the wingtip vortex poses significant challenges for flight safety, especially in crowded airspace near airports, where take-off and landing can be hazardous, particularly at low altitudes. To mitigate these risks, advancements in wing aerodynamics are necessary to reduce wingtip vortex strength, induced drag, and environmental impact. Understanding the near-field dynamics of wingtip vortices is crucial for designing more efficient wingtip devices, which can help reduce vortex strength and improve safety.”
Trailing vortices can persist for great distances downstream before dissipating into the atmosphere. Significant efforts have been made to develop theoretical and numerical models for the roll-up process of trailing wingtip vortices. Most experimental investigations have focused on either tracking the mean velocities of the trailing vortex or validating vortex dynamics numerically. These studies have primarily involved wings of simple rectangular planforms[1], examining the formation and development of tip vortices in the near-field. However, limited information is available on the vortex core’s structure due to experimental resolution constraints.
This study investigates the near-field vortex wake characteristics of a planar wing configuration using stereoscopic particle imaging velocimetry (sPIV) at Re = 1.5 × 10⁶, based on the wing’s mean aerodynamic chord. High-resolution, non-intrusive measurements at 200 Hz were conducted to document wake vortex formation and analyze the evolution of tangential and axial velocity distributions, providing essential validation data for numerical simulations. All results from these measurements can be found in Skinner et al. [2], which offers a detailed description of the test conditions and wind tunnel setup, along with access to the full dataset.
Model geometry
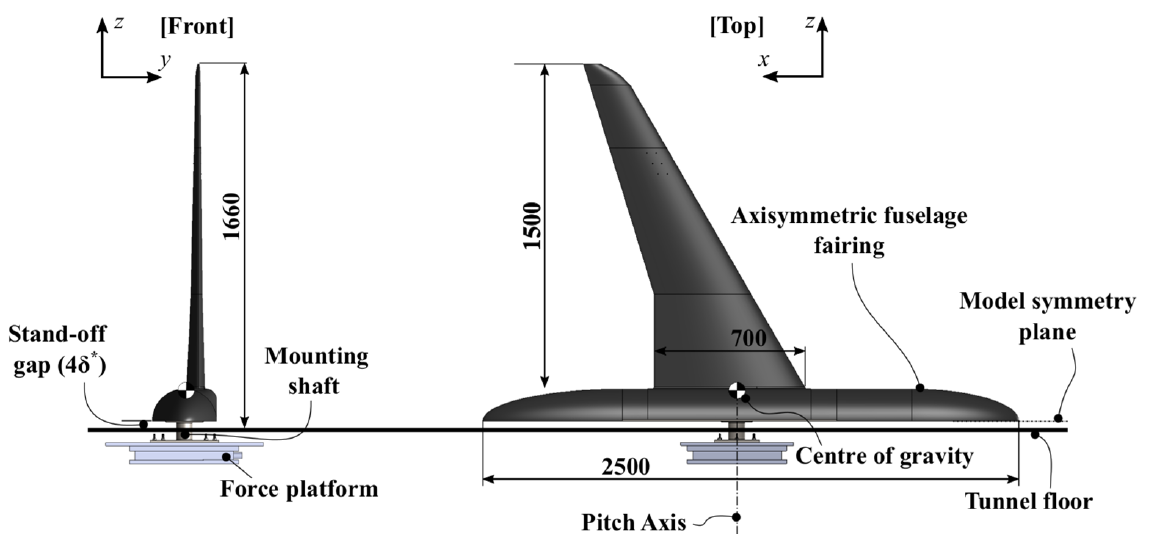
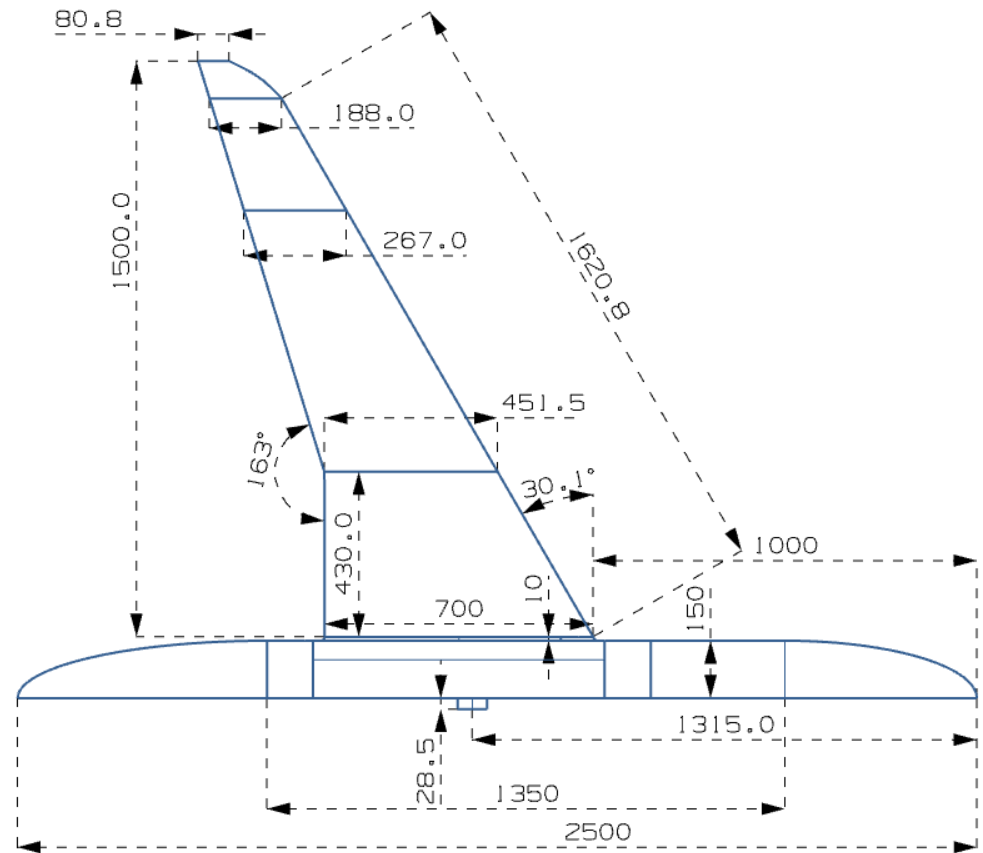
The planar wing shown in Figure. 1 represents a 10% scale model of a midsized commercial transport aircraft wing. The fuselage, a generic axisymmetric half-body fairing, is mounted on an AMTI OR6-7 1000 series force platform beneath the working section’s floor. The force platform’s electromechanical center is aligned with the model’s pitch axis, center of gravity, and aerodynamic center. The force platform is housed within the working section’s 2 m diameter ATE AEROTECH turntable, which controls the model’s angle of attack with a position accuracy of ±\pm0.005o^o. The wing, made from polyurethane foam, is untwisted with a constant NACA 631-412 airfoil section and has an aerodynamically smooth surface with a roughness of less than 0.1 μ\mum (N3 grade). Unlike traditional models, this semi-span model does not use a transitional peniche at the symmetry plane but employs a stand-off gap instead, this helps to prevent the horseshoe vortex formation upstream of the model, discussed in Skinner and Zare-Behtash [3]. This gap is scaled to four times the wind tunnel wall boundary-layer displacement thickness (δ∗\delta ^*) at the model’s pitch axis. The model’s structural dynamics and aerodynamic performance of the wing are discussed in Skinner and Zare-Behtash [4]. The model’s longitudinal location of the aerodynamic center is aligned with its center-of-gravity.
Measurement Locations and Techniques
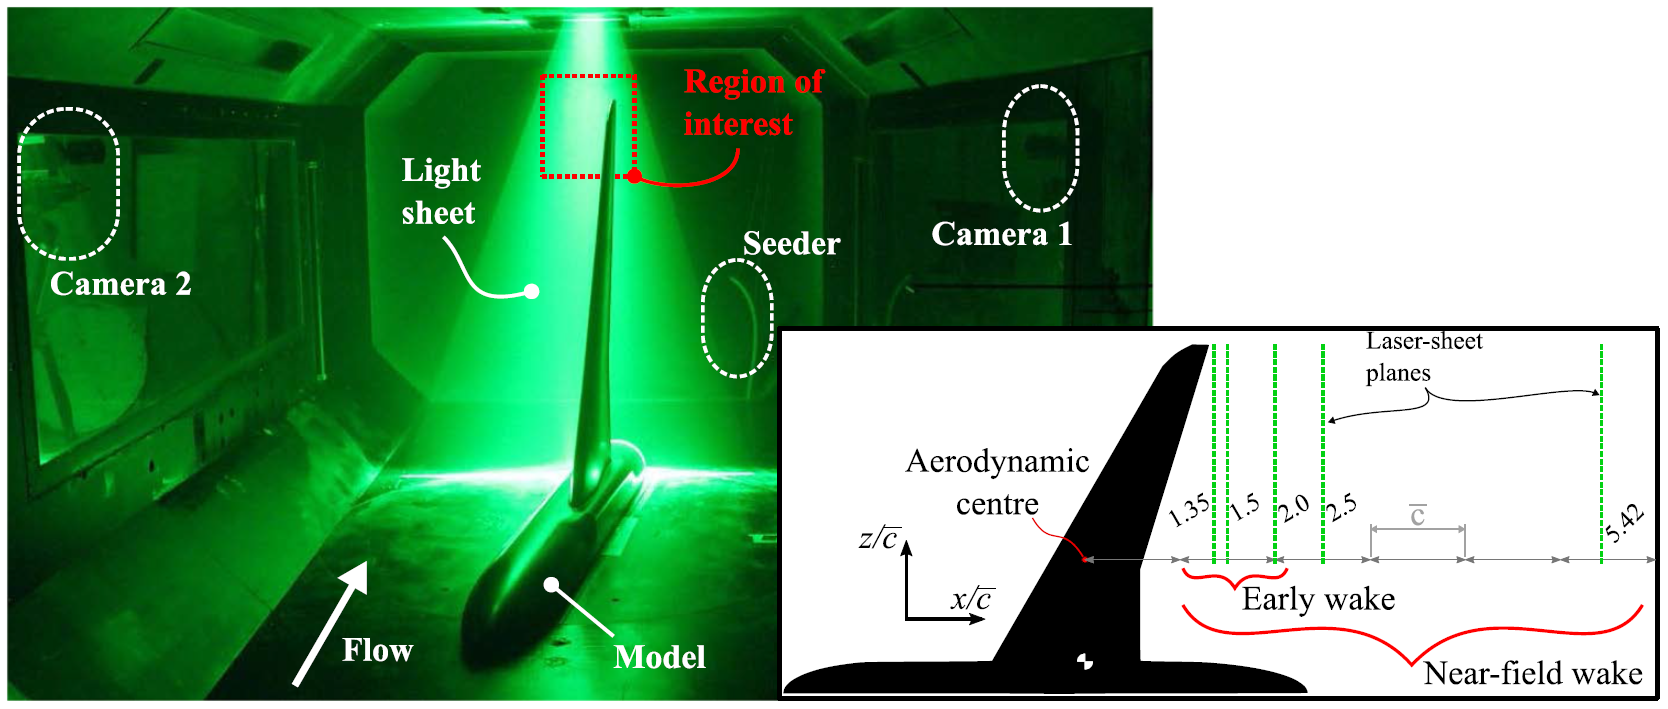
Stereoscopic particle imaging velocimetry (sPIV) has been used to provide the instantaneous and time-averaged global flow field measurements of the near-field trailing vortex. Over a range of angles of attack (between 0o^o and 14), sPIV planes used within this work are located at several distances aft of the wing’s mean aerodynamic center, scaled by the wing mean aerodynamic chord (c‾\overline{c}). For convenience, these planes will be referred to as x/c‾x/\overline{c} = 1.35, 1.5, 2.0, 2.5, and 5.418. Note that the model’s longitudinal location of the aerodynamic center is aligned with its center of gravity. For α≤\alpha \le 8°, the flow remains attached to the wing surface, but beyond this angle, flow separation begins to occur at the wingtip.
Experimental Facility
All tests were performed in the University of Glasgow De Havilland wind tunnel facility. The wind tunnel’s settling chamber to test section contraction ratio is 5:1, and the working section has an octagonal cross section of 2.74 m width, 2.1 m height, and 5 m length with a contraction ratio of 5:1. It can provide a maximum freestream velocity of 70 m/s with good flow uniformity (turbulence intensity levels under 0.2%).
Flow Conditions
Mach number (M∞\infty) = 0.145
Inlet velocity = 50.74 m/s.
Free-stream turbulence ≈\approx 0.4 %.
Reynolds number based on wing mean aerodynamic chord, Re = 1.5 x 10⁶.
All sPIV measurements were conducted in the yy–zz plane.
Wing reference area = 0.5717 m2
Mean aerodynamic chord (MAC, c‾\overline{c} ) = 0.44 m
Time averaged drag coefficient
The absolute values of drag, moments, and their corresponding coefficients can be downloaded from here.
| AoA | CLC_L | CDC_D | CFzC_{Fz} | CMxC_{Mx} (Roll) | CMyC_{My}(Yaw) | CMzC_{Mz}(Pitch) |
|---|---|---|---|---|---|---|
| -5° | -0.24245 | 0.02677 | -0.02587 | -0.47513 | -0.01515 | -0.02913 |
| -4° | -0.14217 | 0.02543 | -0.02272 | -0.27979 | -0.00803 | -0.05537 |
| -3° | -0.04528 | 0.02399 | -0.02023 | -0.08600 | -0.00257 | -0.08080 |
| -2° | 0.05261 | 0.02307 | -0.01805 | 0.10929 | 0.00098 | -0.10723 |
| -1° | 0.14950 | 0.02355 | -0.01608 | 0.30183 | 0.00259 | -0.13390 |
| 0° | 0.25223 | 0.02453 | -0.01620 | 0.50530 | 0.00243 | -0.16115 |
| 1° | 0.35451 | 0.02692 | -0.01749 | 0.70732 | 0.00070 | -0.18728 |
| 2° | 0.45790 | 0.03111 | -0.01860 | 0.91025 | -0.00251 | -0.21349 |
| 3° | 0.55974 | 0.03476 | -0.01928 | 1.11236 | -0.00760 | -0.23886 |
| 4° | 0.66391 | 0.03961 | -0.02306 | 1.31378 | -0.01477 | -0.26228 |
| 5° | 0.76375 | 0.04542 | -0.02917 | 1.50464 | -0.02365 | -0.28291 |
| 6° | 0.85820 | 0.05290 | -0.03879 | 1.68243 | -0.03343 | -0.29885 |
| 7° | 0.94622 | 0.06014 | -0.04834 | 1.84659 | -0.04440 | -0.31229 |
| 8° | 1.03447 | 0.06767 | -0.06028 | 2.00671 | -0.05736 | -0.32364 |
| 9° | 1.11889 | 0.07578 | -0.07396 | 2.15570 | -0.07115 | -0.33226 |
| 10° | 1.19708 | 0.08467 | -0.08916 | 2.28968 | -0.08513 | -0.33628 |
| 11° | 1.27119 | 0.09525 | -0.10579 | 2.40758 | -0.09880 | -0.33654 |
| 12° | 1.33537 | 0.10953 | -0.12254 | 2.49827 | -0.11137 | -0.33156 |
| 13° | 1.39899 | 0.12402 | -0.14357 | 2.57619 | -0.11979 | -0.32265 |
| 14° | 1.44970 | 0.14048 | -0.16156 | 2.63182 | -0.12634 | -0.31094 |
Wind Tunnel Corrections
No corrections have been made to the data.
CAD files
| Planar wing.prt | Planar wing.stp |
|---|
| Planar wing with fuselage.prt | Planar wing with fuselage.stp |
|---|
Mean flow field
The MATLAB code for generating the contour plot can be downloaded from this link.
| x/c = 1.35 | ||||
|---|---|---|---|---|
| Coordinates (y.csv, z.csv) | ||||
| AOA | Mean velocities (.csv) | |||
| 0° | u | v | w | |
| 4° | u | v | w | |
| 6° | u | v | w | |
| 8° | u | v | w | |
| 9° | u | v | w | |
| 10° | u | v | w | |
Open Access
This metadata is provided under the Creative Commons Attribution-NonCommercial 4.0 International License (https://creativecommons.org/licenses/by-nc/4.0/). This license allows for unrestricted use, distribution, and reproduction in any medium, provided that proper credit is given to the original author(s) and the source. Also provide a link to the license, and indicate if any changes were made. Furthermore, this license does not allow the use of this material for commercial purposes.
Acknowledgments
The NWTF acknowledge the support for the metadata work from the EPSRC Network Grant, EP/X011836/1. The original dataset was supported by the National Wind Tunnel Facility (EPSRC Grant No. EP/L024888/1) at the University of Glasgow. Gratitude also goes to Zephyr Business Services (Grant No. 74603) and the Royal Aeronautical Society Centennial Scholarship (Grant No. 21-657/A-SKI) for funding this work.
References
- Zhang, H.J., Zhou, Y. and Whitelaw, J.H., 2006. Near-field wing-tip vortices and exponential vortex solution. Journal of aircraft, 43(2), pp.445-449.DOI
- Skinner, S.N., Green, R.B. and Zare-Behtash, H., 2020. Wingtip vortex structure in the near-field of swept-tapered wings. Physics of Fluids, 32(9). DOI
- Skinner, S.N. and Zare-Behtash, H., 2017. Semi-span wind tunnel testing without conventional peniche. Experiments in Fluids, 58, pp.1-18. DOI
- Skinner, S.N. and Zare-Behtash, H., 2018. Study of a C-wing configuration for passive drag and load alleviation. Journal of Fluids and Structures, 78, pp.175-196. DOI