
Skip to content

Aerodynamics and Aeroacoustics of Stationary and Pitching NACA 0012 and NACA 16-506 Aerofoils

Authors: Michail Hadjipantelis LinkedIn Logo✉ Esmaeel Massoudi LinkedIn Logo✉ Mahdi Azarpeyvand LinkedIn Logo✉

Affiliation : School of Civil, Aerospace and Design Engineering, University of Bristol, Queens Building, University Walk, Bristol, BS8 1TR
✉ mh17262@bristol.ac.uk; ✉ e.masoudi@bristol.ac.uk; ✉ m.azarpeyvand@bristol.ac.uk

Introduction:

Aerodynamic noise from wind turbines, aircraft, propellers, and other aerodynamic systems is an important source of environmental noise. For aerofoils operating under steady conditions, the principal self-noise mechanisms are comparatively well established, including turbulent-boundary-layer trailing-edge noise, laminar-boundary-layer vortex-shedding noise, separation and stall noise, trailing-edge bluntness noise, and tip-vortex noise [1]. Among these, stall noise is associated with large-scale flow separation and increased surface-pressure fluctuations. In many practical applications, however, aerofoils operate under continuously changing conditions. A familiar example is a helicopter rotor blade, which can experience substantial variations in angle of attack as it rotates. Under such rapidly varying inflow or pitching conditions, the aerodynamic response becomes unsteady and the mechanisms governing stall and its associated noise become considerably more complex.

Under these conditions, the instantaneous flow response can differ from that observed at the same angle of attack under stationary conditions. Separation may be delayed beyond the static stall angle, producing aerodynamic hysteresis and large variations in lift and pitching moment [2,3]. Depending on the motion, the aerofoil may undergo light or deep dynamic stall. In deep dynamic stall, the leading-edge shear layer rolls up into a coherent dynamic stall vortex, which grows and convects over the aerofoil before lifting away from the surface. The resulting vortex evolution, large-scale separation and delayed reattachment generate strongly phase-dependent aerodynamic loads and pressure fluctuations. Despite extensive research into the aerodynamics of dynamic stall, the associated aeroacoustic mechanisms remain comparatively less understood.

This dataset provides complementary stationary and pitching measurements for NACA 0012 and NACA 16-506 aerofoils, including aerodynamic loads, surface-pressure distributions, and near-field and far-field pressure measurements. The data enable investigation of stall development and dynamic-stall noise mechanisms, provide benchmark measurements for computational and analytical model validation, and support the development of noise-mitigation strategies for unsteady aerodynamic systems.

Model geometry
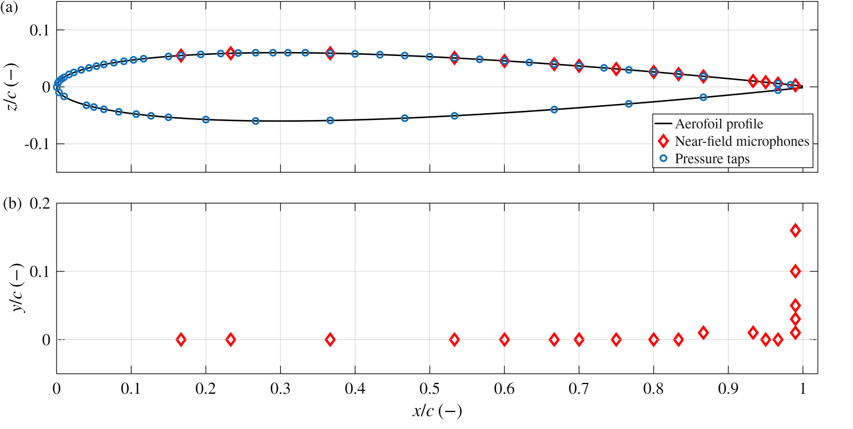

Figure 1. Geometry of the NACA 0012 aerofoil showing (a) the coordinate system and chordwise locations of the pressure taps and near-field microphones, and (b) the corresponding spanwise distribution of the near-field microphones.

The experiments were conducted using NACA 0012 and NACA 16-506 aerofoils, both with a chord length of c = 300 mm and a span of 500 mm within the test section. The profiles are defined using nondimensional coordinates, x/c and y/c, with the coordinate origin located at the leading edge and mid-chord. Both aerofoils were tripped at x/c = 0.1 using a 6 mm wide and 0.5 mm thick zig-zag 3D turbulator trip tape supplied by Glasfaser-Flugzeug-Service GmbH on both the suction and pressure surface. The aerofoil models were mounted to pitch about the quarter-chord axis, with the dynamic motion generated using a servo-motor system positioned outside the Kevlar test section. Similar experimental setups and further inside on a different airfoil can be seen in Masoudi, Zang and Azarpeyvand [4], and Mayer, Zang and Azarpeyvand [5]. The NACA 0012 aerofoil profile and instrumentation layout are shown in Figure 1, including the locations of the surface-pressure taps and near-field microphones. The corresponding aerofoil coordinates and instrumentation locations are provided in a single .csv file, NACA0012_coordinates. The NACA 16-506 aerofoil profile and instrumentation layout are shown in Figure 2, including the corresponding surface-pressure tap and near-field microphone locations. The aerofoil coordinates and instrumentation locations are likewise provided in a single .csv file, NACA16506_coordinates.
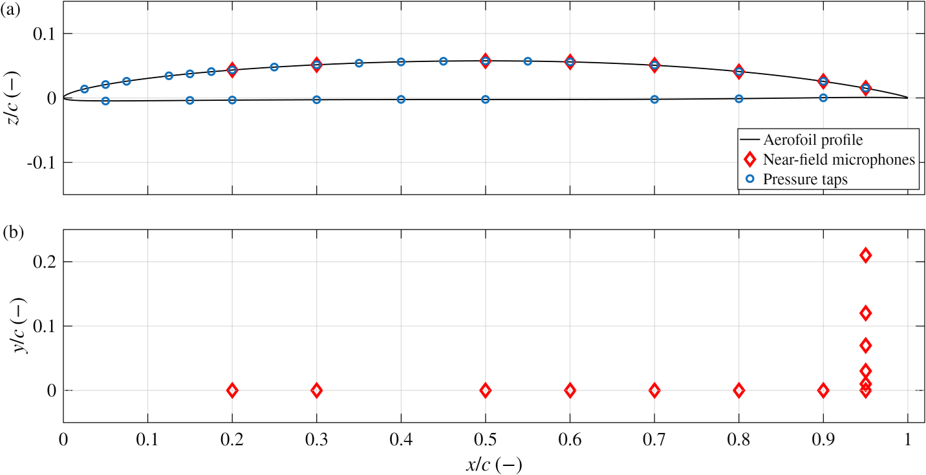

Figure 2. Geometry of the NACA 16-506 aerofoil showing (a) the coordinate system and chordwise locations of the pressure taps and near-field microphones, and (b) the corresponding spanwise distribution of the near-field microphones.

Measurement Locations and Techniques

The experiments combined aerodynamic, surface-pressure and acoustic measurements for stationary and sinusoidally pitching aerofoils. The instantaneous aerofoil angle was independently measured using a laser displacement sensor to accurately capture the airfoil’s motion. Steady surface-pressure measurements were obtained using pressure taps distributed over the suction and pressure surfaces of the aerofoil. These measurements were used to determine chordwise pressure-coefficient distributions and the corresponding aerodynamic lift and pitching-moment coefficients.
Unsteady pressure measurements were acquired using near-field microphones positioned beneath small surface pinholes distributed along the aerofoil chord. For the NACA 0012 aerofoil, the chordwise microphones were installed directly beneath the surface pinholes, while the microphones located near the trailing edge employed a remote-sensing arrangement [5,7,8]. In contrast, all microphones used for the NACA165-506 aerofoil employed remote sensing. These measurements were processed to obtain the surface-pressure power spectral densities (PSDs) and signal energy content (SEC) quantities.
The SEC is defined as:

SEC=10log⁡10(1p02∫f1f2ϕpp df)SEC = 10\log_{10}\left(\frac{1}{p_0^2}\int_{f_1}^{f_2}{\phi}_{pp}\,df\right)

where ϕpp{\phi}_{pp} represents the surface-pressure power spectral density.

For the NACA 0012 dataset, the SEC is integrated over f1=160Hz and f2=10kHz. For the NACA 16-series dataset, f2 is restricted to 5 kHz. This reduced frequency range reflects the bandwidth limitation associated with the remote-sensing surface-pressure measurement used for the NACA 16-series experiments, for which reliable surface-pressure data are available only up to approximately 5 kHz. The SEC therefore provides a nondimensional measure of the integrated surface-pressure fluctuation energy over the usable frequency range of each dataset.
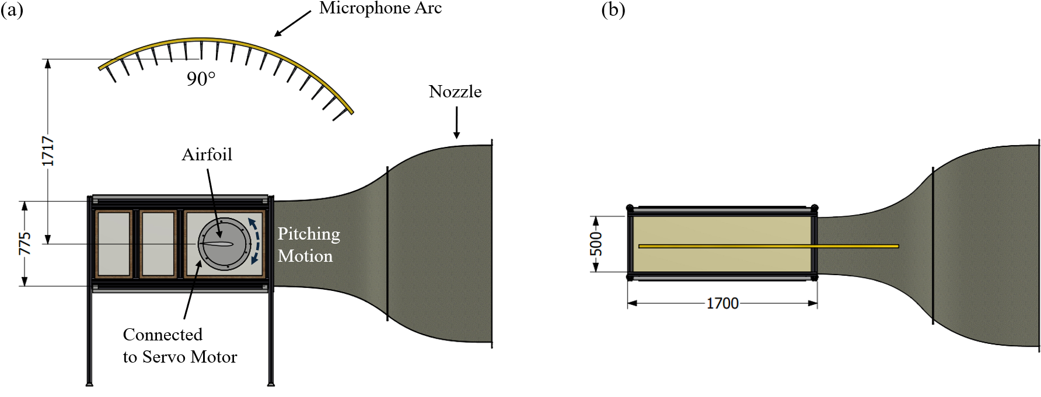

Figure 3. Annotated drawing of the experimental setup: (a) front view and (b) top view.

Far-field acoustic measurements were obtained using an overhead microphone array positioned above the aerofoil. The published dataset includes the microphone located at 90°, positioned vertically above the aerofoil as shown in Figure 3(a). This microphone was located 1.717 m from the aerofoil trailing edge when the aerofoil is at α\alpha = 0∘^\circ.

Experimental Facility

The experiments were conducted in the University of Bristol aeroacoustic wind tunnel, a temperature-controlled, closed-circuit facility with an open-jet test section designed for aerodynamic and aeroacoustic measurements [6]. The tunnel operates over a free-stream velocity range of 4–40 m/s and can achieve turbulence intensities as low as 0.2%. The contraction nozzle has an exit width of 0.50 m and a height of 0.775 m. The aeroacoustic test chamber measures 7.9 m × 5.0 m × 4.6 m and is acoustically treated, providing effectively anechoic conditions above 160 Hz. The experimental arrangement is illustrated in Figure 3, which shows annotated front and top views of the setup. The aerofoil model was installed within a Kevlar-walled test section. The Kevlar walls minimise disturbance to the aerodynamic flow while allowing acoustic radiation to propagate through the test-section boundaries for far-field measurements. Exposed surfaces within the chamber and the model-support structures were acoustically treated to minimise unwanted reflections. Corrections for acoustic attenuation associated with the Kevlar walls and the test-section boundary layers have been reported by Devenport et al [7]. These corrections have not been applied to the far-field data provided in this dataset. Keen readers can follow the method outlined in Mayer[8].

Aerofoil Coordinates and Pressure Tap Locations

NACA0012_coordinates.
NACA16506_coordinates.

Flow Conditions

  • Freestream velocity: U∞=20U_\infty = 20 m/s
  • Chord-based Reynolds number: Rec≈4.2×10⁵Re_c \approx 4.2 \times 10^5
  • Stationary angles of attack: α=0∘\alpha = 0^\circ–27∘27^\circ
  • Sampling frequency: 2152^{15} Hz
  • Measurement duration per case:
    • Stationary cases: 32 s
    • Dynamic cases: Time to complete 50 cycles
  • Reduced frequency: k=fcU∞k = \frac{fc}{U_\infty}
  • Dynamic test cases
NACA0012
Mean angle, α₀ Pitching amplitudes, A k = 0.02 k = 0.05 k = 0.1
5° 4° ✓ ✓ ✓
10° 4°, 8°, 12° ✓ ✓ ✓
12° 4°, 8°, 12° ✓ ✓ ✓
15° 4°, 8°, 12° ✓ ✓ ✓
NACA16506
Mean angle, α₀ Pitching amplitudes, A k = 0.02 k = 0.05 k = 0.1
5° 4° ✓ ✓ ✓
10° 4°, 8°, 12° ✓ ✓ ✓
12° 4°, 8°, 12° ✓ ✓ ✓
15° 4°, 8° ✓ ✓ ✓
15° 12° ✓ ✓ —

The airfoil starts at the minimum angle of attack at t/T=0t/T = 0, pitches up to the maximum angle at t/T=0.5t/T = 0.5, and returns to the minimum angle at t/T=1t/T = 1, completing one sinusoidal pitching cycle.

Available Datasets

(i) Stationary test cases – NACA0012

Angle of Attack Lift Coefficient Pitching Moment Coefficient Overall Sound Pressure Level (dB) Mean Pressure Coefficient Root-mean Square Coefficient Surface Pressure Fluctuations Signal Energy Content
0° 0.0417 0.00485 15.2125 CP_mean_aoa0.csv CP_rms_aoa0.csv Phi_pp_aoa0.csv SEC_aoa0.csv
1° 0.1105 0.00341 16.0690 CP_mean_aoa1.csv CP_rms_aoa1.csv Phi_pp_aoa1.csv SEC_aoa1.csv
2° 0.1889 0.00201 15.6408 CP_mean_aoa2.csv CP_rms_aoa2.csv Phi_pp_aoa2.csv SEC_aoa2.csv
3° 0.2702 0.00069 17.0645 CP_mean_aoa3.csv CP_rms_aoa3.csv Phi_pp_aoa3.csv SEC_aoa3.csv
4° 0.3530 -0.00081 16.7681 CP_mean_aoa4.csv CP_rms_aoa4.csv Phi_pp_aoa4.csv SEC_aoa4.csv
5° 0.4374 -0.00209 15.8772 CP_mean_aoa5.csv CP_rms_aoa5.csv Phi_pp_aoa5.csv SEC_aoa5.csv
6° 0.5143 -0.00362 16.9218 CP_mean_aoa6.csv CP_rms_aoa6.csv Phi_pp_aoa6.csv SEC_aoa6.csv
7° 0.5969 -0.00585 16.9600 CP_mean_aoa7.csv CP_rms_aoa7.csv Phi_pp_aoa7.csv SEC_aoa7.csv
8° 0.6585 -0.00845 16.9931 CP_mean_aoa8.csv CP_rms_aoa8.csv Phi_pp_aoa8.csv SEC_aoa8.csv
9° 0.7207 -0.01127 16.7124 CP_mean_aoa9.csv CP_rms_aoa9.csv Phi_pp_aoa9.csv SEC_aoa9.csv
10° 0.7748 -0.01422 17.0694 CP_mean_aoa10.csv CP_rms_aoa10.csv Phi_pp_aoa10.csv SEC_aoa10.csv
11° 0.8267 -0.01904 17.5203 CP_mean_aoa11.csv CP_rms_aoa11.csv Phi_pp_aoa11.csv SEC_aoa11.csv
12° 0.8654 -0.02293 17.0941 CP_mean_aoa12.csv CP_rms_aoa12.csv Phi_pp_aoa12.csv SEC_aoa12.csv
13° 0.8749 -0.02464 17.1518 CP_mean_aoa13.csv CP_rms_aoa13.csv Phi_pp_aoa13.csv SEC_aoa13.csv
14° 0.7385 0.10814 20.7333 CP_mean_aoa14.csv CP_rms_aoa14.csv Phi_pp_aoa14.csv SEC_aoa14.csv
15° 0.7254 0.11147 20.6218 CP_mean_aoa15.csv CP_rms_aoa15.csv Phi_pp_aoa15.csv SEC_aoa15.csv
16° 0.7314 0.11201 20.5066 CP_mean_aoa16.csv CP_rms_aoa16.csv Phi_pp_aoa16.csv SEC_aoa16.csv
17° 0.7420 0.11306 20.6975 CP_mean_aoa17.csv CP_rms_aoa17.csv Phi_pp_aoa17.csv SEC_aoa17.csv
18° 0.7459 0.11111 20.6233 CP_mean_aoa18.csv CP_rms_aoa18.csv Phi_pp_aoa18.csv SEC_aoa18.csv
19° 0.7717 0.11441 20.4633 CP_mean_aoa19.csv CP_rms_aoa19.csv Phi_pp_aoa19.csv SEC_aoa19.csv
20° 0.7798 0.11328 19.9026 CP_mean_aoa20.csv CP_rms_aoa20.csv Phi_pp_aoa20.csv SEC_aoa20.csv
21° 0.7987 0.11566 19.0996 CP_mean_aoa21.csv CP_rms_aoa21.csv Phi_pp_aoa21.csv SEC_aoa21.csv
22° 0.8177 0.11110 19.7522 CP_mean_aoa22.csv CP_rms_aoa22.csv Phi_pp_aoa22.csv SEC_aoa22.csv
23° 0.8554 0.11740 19.6810 CP_mean_aoa23.csv CP_rms_aoa23.csv Phi_pp_aoa23.csv SEC_aoa23.csv
24° 0.8937 0.12446 19.7453 CP_mean_aoa24.csv CP_rms_aoa24.csv Phi_pp_aoa24.csv SEC_aoa24.csv
25° 0.9300 0.13161 20.4486 CP_mean_aoa25.csv CP_rms_aoa25.csv Phi_pp_aoa25.csv SEC_aoa25.csv
26° 0.9772 0.14114 21.2752 CP_mean_aoa26.csv CP_rms_aoa26.csv Phi_pp_aoa26.csv SEC_aoa26.csv
27° 1.0247 0.15028 21.8789 CP_mean_aoa27.csv CP_rms_aoa27.csv Phi_pp_aoa27.csv SEC_aoa27.csv

(ii) Dynamic Test Cases – NACA0012

k = 0.02, NACA 0012
Case Lift Coefficient Pitching Moment Coefficient Overall Sound Pressure Level Mean Pressure Coefficient Surface Pressure Fluctuations Signal Energy Content
α₀ = 5°
A = 4°
CL_a0_5_A_4.csv CM_a0_5_A_4.csv OASPL_a0_5_A_4.csv Cp_a0_5_A_4.csv Phi_pp_a0_5_A_4.csv SEC_a0_5_A_4.csv
α₀ = 10°
A = 4°
CL_a0_10_A_4.csv CM_a0_10_A_4.csv OASPL_a0_10_A_4.csv Cp_a0_10_A_4.csv Phi_pp_a0_10_A_4.csv SEC_a0_10_A_4.csv
α₀ = 10°
A = 8°
CL_a0_10_A_8.csv CM_a0_10_A_8.csv OASPL_a0_10_A_8.csv Cp_a0_10_A_8.csv Phi_pp_a0_10_A_8.csv SEC_a0_10_A_8.csv
α₀ = 10°
A = 12°
CL_a0_10_A_12.csv CM_a0_10_A_12.csv OASPL_a0_10_A_12.csv Cp_a0_10_A_12.csv Phi_pp_a0_10_A_12.csv SEC_a0_10_A_12.csv
α₀ = 12°
A = 4°
CL_a0_12_A_4.csv CM_a0_12_A_4.csv OASPL_a0_12_A_4.csv Cp_a0_12_A_4.csv Phi_pp_a0_12_A_4.csv SEC_a0_12_A_4.csv
α₀ = 12°
A = 8°
CL_a0_12_A_8.csv CM_a0_12_A_8.csv OASPL_a0_12_A_8.csv Cp_a0_12_A_8.csv Phi_pp_a0_12_A_8.csv SEC_a0_12_A_8.csv
α₀ = 12°
A = 12°
CL_a0_12_A_12.csv CM_a0_12_A_12.csv OASPL_a0_12_A_12.csv Cp_a0_12_A_12.csv Phi_pp_a0_12_A_12.csv SEC_a0_12_A_12.csv
α₀ = 15°
A = 4°
CL_a0_15_A_4.csv CM_a0_15_A_4.csv OASPL_a0_15_A_4.csv Cp_a0_15_A_4.csv Phi_pp_a0_15_A_4.csv SEC_a0_15_A_4.csv
α₀ = 15°
A = 8°
CL_a0_15_A_8.csv CM_a0_15_A_8.csv OASPL_a0_15_A_8.csv Cp_a0_15_A_8.csv Phi_pp_a0_15_A_8.csv SEC_a0_15_A_8.csv
α₀ = 15°
A = 12°
CL_a0_15_A_12.csv CM_a0_15_A_12.csv OASPL_a0_15_A_12.csv Cp_a0_15_A_12.csv Phi_pp_a0_15_A_12.csv SEC_a0_15_A_12.csv
k = 0.05, NACA 0012
Case Lift Coefficient Pitching Moment Coefficient Overall Sound Pressure Level Mean Pressure Coefficient Surface Pressure Fluctuations Signal Energy Content
α₀ = 5°
A = 4°
CL_a0_5_A_4.csv CM_a0_5_A_4.csv OASPL_a0_5_A_4.csv Cp_a0_5_A_4.csv Phi_pp_a0_5_A_4.csv SEC_a0_5_A_4.csv
α₀ = 10°
A = 4°
CL_a0_10_A_4.csv CM_a0_10_A_4.csv OASPL_a0_10_A_4.csv Cp_a0_10_A_4.csv Phi_pp_a0_10_A_4.csv SEC_a0_10_A_4.csv
α₀ = 10°
A = 8°
CL_a0_10_A_8.csv CM_a0_10_A_8.csv OASPL_a0_10_A_8.csv Cp_a0_10_A_8.csv Phi_pp_a0_10_A_8.csv SEC_a0_10_A_8.csv
α₀ = 10°
A = 12°
CL_a0_10_A_12.csv CM_a0_10_A_12.csv OASPL_a0_10_A_12.csv Cp_a0_10_A_12.csv Phi_pp_a0_10_A_12.csv SEC_a0_10_A_12.csv
α₀ = 12°
A = 4°
CL_a0_12_A_4.csv CM_a0_12_A_4.csv OASPL_a0_12_A_4.csv Cp_a0_12_A_4.csv Phi_pp_a0_12_A_4.csv SEC_a0_12_A_4.csv
α₀ = 12°
A = 8°
CL_a0_12_A_8.csv CM_a0_12_A_8.csv OASPL_a0_12_A_8.csv Cp_a0_12_A_8.csv Phi_pp_a0_12_A_8.csv SEC_a0_12_A_8.csv
α₀ = 12°
A = 12°
CL_a0_12_A_12.csv CM_a0_12_A_12.csv OASPL_a0_12_A_12.csv Cp_a0_12_A_12.csv Phi_pp_a0_12_A_12.csv SEC_a0_12_A_12.csv
α₀ = 15°
A = 4°
CL_a0_15_A_4.csv CM_a0_15_A_4.csv OASPL_a0_15_A_4.csv Cp_a0_15_A_4.csv Phi_pp_a0_15_A_4.csv SEC_a0_15_A_4.csv
α₀ = 15°
A = 8°
CL_a0_15_A_8.csv CM_a0_15_A_8.csv OASPL_a0_15_A_8.csv Cp_a0_15_A_8.csv Phi_pp_a0_15_A_8.csv SEC_a0_15_A_8.csv
α₀ = 15°
A = 12°
CL_a0_15_A_12.csv CM_a0_15_A_12.csv OASPL_a0_15_A_12.csv Cp_a0_15_A_12.csv Phi_pp_a0_15_A_12.csv SEC_a0_15_A_12.csv
k = 0.1, NACA 0012
Case Lift Coefficient Pitching Moment Coefficient Overall Sound Pressure Level Mean Pressure Coefficient Surface Pressure Fluctuations Signal Energy Content
α₀ = 5°
A = 4°
CL_a0_5_A_4.csv CM_a0_5_A_4.csv OASPL_a0_5_A_4.csv Cp_a0_5_A_4.csv Phi_pp_a0_5_A_4.csv SEC_a0_5_A_4.csv
α₀ = 10°
A = 4°
CL_a0_10_A_4.csv CM_a0_10_A_4.csv OASPL_a0_10_A_4.csv Cp_a0_10_A_4.csv Phi_pp_a0_10_A_4.csv SEC_a0_10_A_4.csv
α₀ = 10°
A = 8°
CL_a0_10_A_8.csv CM_a0_10_A_8.csv OASPL_a0_10_A_8.csv Cp_a0_10_A_8.csv Phi_pp_a0_10_A_8.csv SEC_a0_10_A_8.csv
α₀ = 10°
A = 12°
CL_a0_10_A_12.csv CM_a0_10_A_12.csv OASPL_a0_10_A_12.csv Cp_a0_10_A_12.csv Phi_pp_a0_10_A_12.csv SEC_a0_10_A_12.csv
α₀ = 12°
A = 4°
CL_a0_12_A_4.csv CM_a0_12_A_4.csv OASPL_a0_12_A_4.csv Cp_a0_12_A_4.csv Phi_pp_a0_12_A_4.csv SEC_a0_12_A_4.csv
α₀ = 12°
A = 8°
CL_a0_12_A_8.csv CM_a0_12_A_8.csv OASPL_a0_12_A_8.csv Cp_a0_12_A_8.csv Phi_pp_a0_12_A_8.csv SEC_a0_12_A_8.csv
α₀ = 12°
A = 12°
CL_a0_12_A_12.csv CM_a0_12_A_12.csv OASPL_a0_12_A_12.csv Cp_a0_12_A_12.csv Phi_pp_a0_12_A_12.csv SEC_a0_12_A_12.csv
α₀ = 15°
A = 4°
CL_a0_15_A_4.csv CM_a0_15_A_4.csv OASPL_a0_15_A_4.csv Cp_a0_15_A_4.csv Phi_pp_a0_15_A_4.csv SEC_a0_15_A_4.csv
α₀ = 15°
A = 8°
CL_a0_15_A_8.csv CM_a0_15_A_8.csv OASPL_a0_15_A_8.csv Cp_a0_15_A_8.csv Phi_pp_a0_15_A_8.csv SEC_a0_15_A_8.csv
α₀ = 15°
A = 12°
CL_a0_15_A_12.csv CM_a0_15_A_12.csv OASPL_a0_15_A_12.csv Cp_a0_15_A_12.csv Phi_pp_a0_15_A_12.csv SEC_a0_15_A_12.csv

(iii) Stationary test cases – NACA16506

Angle of Attack Lift Coefficient Pitching Moment Coefficient Overall Sound Pressure Level (dB) Mean Pressure Coefficient Root-mean Square Coefficient Surface Pressure Fluctuations Signal Energy Content
0° 0.2557 0.0703 15.8792 CP_mean_aoa0.csv CP_rms_aoa0.csv Phi_pp_aoa0.csv SEC_aoa0.csv
1° 0.3161 0.0733 15.7506 CP_mean_aoa1.csv CP_rms_aoa1.csv Phi_pp_aoa1.csv SEC_aoa1.csv
2° 0.3792 0.0768 15.9120 CP_mean_aoa2.csv CP_rms_aoa2.csv Phi_pp_aoa2.csv SEC_aoa2.csv
3° 0.4431 0.0796 16.3025 CP_mean_aoa3.csv CP_rms_aoa3.csv Phi_pp_aoa3.csv SEC_aoa3.csv
4° 0.5058 0.0825 16.3619 CP_mean_aoa4.csv CP_rms_aoa4.csv Phi_pp_aoa4.csv SEC_aoa4.csv
5° 0.5686 0.0848 16.7004 CP_mean_aoa5.csv CP_rms_aoa5.csv Phi_pp_aoa5.csv SEC_aoa5.csv
6° 0.6164 0.0848 17.6691 CP_mean_aoa6.csv CP_rms_aoa6.csv Phi_pp_aoa6.csv SEC_aoa6.csv
7° 0.6590 0.0819 17.5464 CP_mean_aoa7.csv CP_rms_aoa7.csv Phi_pp_aoa7.csv SEC_aoa7.csv
8° 0.7508 0.0733 18.6537 CP_mean_aoa8.csv CP_rms_aoa8.csv Phi_pp_aoa8.csv SEC_aoa8.csv
9° 0.8249 0.0652 19.9986 CP_mean_aoa9.csv CP_rms_aoa9.csv Phi_pp_aoa9.csv SEC_aoa9.csv
10° 0.8908 0.0683 21.4343 CP_mean_aoa10.csv CP_rms_aoa10.csv Phi_pp_aoa10.csv SEC_aoa10.csv
11° 0.9297 0.0901 21.7464 CP_mean_aoa11.csv CP_rms_aoa11.csv Phi_pp_aoa11.csv SEC_aoa11.csv
12° 0.9344 0.1182 21.1960 CP_mean_aoa12.csv CP_rms_aoa12.csv Phi_pp_aoa12.csv SEC_aoa12.csv
13° 0.9138 0.1377 20.4724 CP_mean_aoa13.csv CP_rms_aoa13.csv Phi_pp_aoa13.csv SEC_aoa13.csv
14° 0.8809 0.1512 19.8190 CP_mean_aoa14.csv CP_rms_aoa14.csv Phi_pp_aoa14.csv SEC_aoa14.csv
15° 0.8242 0.1533 19.1331 CP_mean_aoa15.csv CP_rms_aoa15.csv Phi_pp_aoa15.csv SEC_aoa15.csv
16° 0.8120 0.1539 19.0355 CP_mean_aoa16.csv CP_rms_aoa16.csv Phi_pp_aoa16.csv SEC_aoa16.csv
17° 0.8232 0.1563 19.1188 CP_mean_aoa17.csv CP_rms_aoa17.csv Phi_pp_aoa17.csv SEC_aoa17.csv
18° 0.8747 0.1669 20.1284 CP_mean_aoa18.csv CP_rms_aoa18.csv Phi_pp_aoa18.csv SEC_aoa18.csv
19° 0.9288 0.1775 20.1961 CP_mean_aoa19.csv CP_rms_aoa19.csv Phi_pp_aoa19.csv SEC_aoa19.csv
20° 0.9527 0.1806 21.2619 CP_mean_aoa20.csv CP_rms_aoa20.csv Phi_pp_aoa20.csv SEC_aoa20.csv
21° 0.9812 0.1847 20.2385 CP_mean_aoa21.csv CP_rms_aoa21.csv Phi_pp_aoa21.csv SEC_aoa21.csv
22° 1.0086 0.1892 20.0554 CP_mean_aoa22.csv CP_rms_aoa22.csv Phi_pp_aoa22.csv SEC_aoa22.csv
23° 1.0417 0.1956 20.3226 CP_mean_aoa23.csv CP_rms_aoa23.csv Phi_pp_aoa23.csv SEC_aoa23.csv
24° 1.0796 0.2031 23.0705 CP_mean_aoa24.csv CP_rms_aoa24.csv Phi_pp_aoa24.csv SEC_aoa24.csv
25° 1.1147 0.2109 21.3397 CP_mean_aoa25.csv CP_rms_aoa25.csv Phi_pp_aoa25.csv SEC_aoa25.csv
26° 1.1782 0.2234 22.6728 CP_mean_aoa26.csv CP_rms_aoa26.csv Phi_pp_aoa26.csv SEC_aoa26.csv
27° 1.2403 0.2361 24.4044 CP_mean_aoa27.csv CP_rms_aoa27.csv Phi_pp_aoa27.csv SEC_aoa27.csv

(iv) Dynamic Test Cases – NACA16506

k = 0.02, NACA 16506
Case Lift Coefficient Pitching Moment Coefficient Overall Sound Pressure Level Mean Pressure Coefficient Surface Pressure Fluctuations Signal Energy Content
α₀ = 5°
A = 4°
CL_a0_5_A_4.csv CM_a0_5_A_4.csv OASPL_a0_5_A_4.csv Cp_a0_5_A_4.csv Phi_pp_a0_5_A_4.csv SEC_a0_5_A_4.csv
α₀ = 10°
A = 4°
CL_a0_10_A_4.csv CM_a0_10_A_4.csv OASPL_a0_10_A_4.csv Cp_a0_10_A_4.csv Phi_pp_a0_10_A_4.csv SEC_a0_10_A_4.csv
α₀ = 10°
A = 8°
CL_a0_10_A_8.csv CM_a0_10_A_8.csv OASPL_a0_10_A_8.csv Cp_a0_10_A_8.csv Phi_pp_a0_10_A_8.csv SEC_a0_10_A_8.csv
α₀ = 10°
A = 12°
CL_a0_10_A_12.csv CM_a0_10_A_12.csv OASPL_a0_10_A_12.csv Cp_a0_10_A_12.csv Phi_pp_a0_10_A_12.csv SEC_a0_10_A_12.csv
α₀ = 12°
A = 4°
CL_a0_12_A_4.csv CM_a0_12_A_4.csv OASPL_a0_12_A_4.csv Cp_a0_12_A_4.csv Phi_pp_a0_12_A_4.csv SEC_a0_12_A_4.csv
α₀ = 12°
A = 8°
CL_a0_12_A_8.csv CM_a0_12_A_8.csv OASPL_a0_12_A_8.csv Cp_a0_12_A_8.csv Phi_pp_a0_12_A_8.csv SEC_a0_12_A_8.csv
α₀ = 12°
A = 12°
CL_a0_12_A_12.csv CM_a0_12_A_12.csv OASPL_a0_12_A_12.csv Cp_a0_12_A_12.csv Phi_pp_a0_12_A_12.csv SEC_a0_12_A_12.csv
α₀ = 15°
A = 4°
CL_a0_15_A_4.csv CM_a0_15_A_4.csv OASPL_a0_15_A_4.csv Cp_a0_15_A_4.csv Phi_pp_a0_15_A_4.csv SEC_a0_15_A_4.csv
α₀ = 15°
A = 8°
CL_a0_15_A_8.csv CM_a0_15_A_8.csv OASPL_a0_15_A_8.csv Cp_a0_15_A_8.csv Phi_pp_a0_15_A_8.csv SEC_a0_15_A_8.csv
α₀ = 15°
A = 12°
CL_a0_15_A_12.csv CM_a0_15_A_12.csv OASPL_a0_15_A_12.csv Cp_a0_15_A_12.csv Phi_pp_a0_15_A_12.csv SEC_a0_15_A_12.csv
k = 0.05, NACA 16506
Case Lift Coefficient Pitching Moment Coefficient Overall Sound Pressure Level Mean Pressure Coefficient Surface Pressure Fluctuations Signal Energy Content
α₀ = 5°
A = 4°
CL_a0_5_A_4.csv CM_a0_5_A_4.csv OASPL_a0_5_A_4.csv Cp_a0_5_A_4.csv Phi_pp_a0_5_A_4.csv SEC_a0_5_A_4.csv
α₀ = 10°
A = 4°
CL_a0_10_A_4.csv CM_a0_10_A_4.csv OASPL_a0_10_A_4.csv Cp_a0_10_A_4.csv Phi_pp_a0_10_A_4.csv SEC_a0_10_A_4.csv
α₀ = 10°
A = 8°
CL_a0_10_A_8.csv CM_a0_10_A_8.csv OASPL_a0_10_A_8.csv Cp_a0_10_A_8.csv Phi_pp_a0_10_A_8.csv SEC_a0_10_A_8.csv
α₀ = 10°
A = 12°
CL_a0_10_A_12.csv CM_a0_10_A_12.csv OASPL_a0_10_A_12.csv Cp_a0_10_A_12.csv Phi_pp_a0_10_A_12.csv SEC_a0_10_A_12.csv
α₀ = 12°
A = 4°
CL_a0_12_A_4.csv CM_a0_12_A_4.csv OASPL_a0_12_A_4.csv Cp_a0_12_A_4.csv Phi_pp_a0_12_A_4.csv SEC_a0_12_A_4.csv
α₀ = 12°
A = 8°
CL_a0_12_A_8.csv CM_a0_12_A_8.csv OASPL_a0_12_A_8.csv Cp_a0_12_A_8.csv Phi_pp_a0_12_A_8.csv SEC_a0_12_A_8.csv
α₀ = 12°
A = 12°
CL_a0_12_A_12.csv CM_a0_12_A_12.csv OASPL_a0_12_A_12.csv Cp_a0_12_A_12.csv Phi_pp_a0_12_A_12.csv SEC_a0_12_A_12.csv
α₀ = 15°
A = 4°
CL_a0_15_A_4.csv CM_a0_15_A_4.csv OASPL_a0_15_A_4.csv Cp_a0_15_A_4.csv Phi_pp_a0_15_A_4.csv SEC_a0_15_A_4.csv
α₀ = 15°
A = 8°
CL_a0_15_A_8.csv CM_a0_15_A_8.csv OASPL_a0_15_A_8.csv Cp_a0_15_A_8.csv Phi_pp_a0_15_A_8.csv SEC_a0_15_A_8.csv
α₀ = 15°
A = 12°
CL_a0_15_A_12.csv CM_a0_15_A_12.csv OASPL_a0_15_A_12.csv Cp_a0_15_A_12.csv Phi_pp_a0_15_A_12.csv SEC_a0_15_A_12.csv
k = 0.1, NACA 16506
Case Pitching Moment Coefficient Overall Sound Pressure Level Mean Pressure Coefficient Surface Pressure Fluctuations Signal Energy Content
α₀ = 5°
A = 4°
CM_a0_5_A_4.csv OASPL_a0_5_A_4.csv Cp_a0_5_A_4.csv Phi_pp_a0_5_A_4.csv SEC_a0_5_A_4.csv
α₀ = 10°
A = 4°
CM_a0_10_A_4.csv OASPL_a0_10_A_4.csv Cp_a0_10_A_4.csv Phi_pp_a0_10_A_4.csv SEC_a0_10_A_4.csv
α₀ = 10°
A = 8°
CM_a0_10_A_8.csv OASPL_a0_10_A_8.csv Cp_a0_10_A_8.csv Phi_pp_a0_10_A_8.csv SEC_a0_10_A_8.csv
α₀ = 10°
A = 12°
CM_a0_10_A_12.csv OASPL_a0_10_A_12.csv Cp_a0_10_A_12.csv Phi_pp_a0_10_A_12.csv SEC_a0_10_A_12.csv
α₀ = 12°
A = 4°
CM_a0_12_A_4.csv OASPL_a0_12_A_4.csv Cp_a0_12_A_4.csv Phi_pp_a0_12_A_4.csv SEC_a0_12_A_4.csv
α₀ = 12°
A = 8°
CM_a0_12_A_8.csv OASPL_a0_12_A_8.csv Cp_a0_12_A_8.csv Phi_pp_a0_12_A_8.csv SEC_a0_12_A_8.csv
α₀ = 12°
A = 12°
CM_a0_12_A_12.csv OASPL_a0_12_A_12.csv Cp_a0_12_A_12.csv Phi_pp_a0_12_A_12.csv SEC_a0_12_A_12.csv
α₀ = 15°
A = 4°
CM_a0_15_A_4.csv OASPL_a0_15_A_4.csv Cp_a0_15_A_4.csv Phi_pp_a0_15_A_4.csv SEC_a0_15_A_4.csv
α₀ = 15°
A = 8°
CM_a0_15_A_8.csv OASPL_a0_15_A_8.csv Cp_a0_15_A_8.csv Phi_pp_a0_15_A_8.csv SEC_a0_15_A_8.csv

Code and Sample plots

A MATLAB script plot_NWTF_CSV.mat is provided to demonstrate how to access, process and visualise the submitted dataset. Example outputs generated using the supplied scripts are shown in Figure 4.
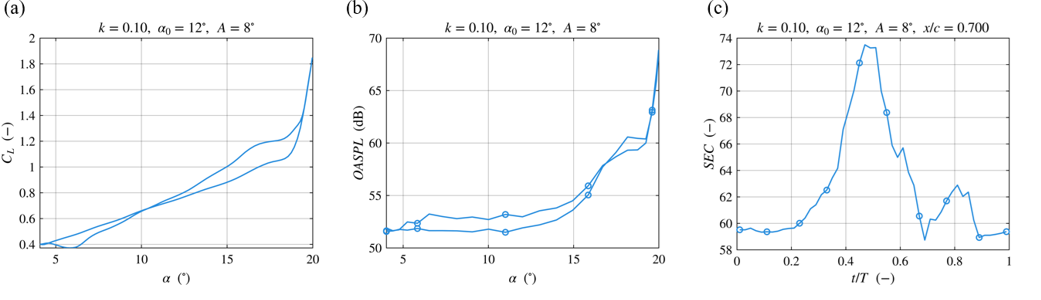

Figure 4. (a) lift coefficient, CL, versus angle of attack, (b) far-field OASPL versus angle of attack, and (c) surface-pressure energy coefficient (SEC) versus normalised pitching-cycle time, t/T.

Complete Dataset

The complete dataset is available for download here. It contains the full experimental datasets for both the NACA 0012 and NACA 16-506 aerofoils, together with a user guide for each dataset explaining the file structure and how to access the stored variables. The datasets include both stationary and dynamically pitching conditions and contain the processed aerodynamic and aeroacoustic measurements used in the study. Raw files have not been stored in the h5 file; however, it is a more compact way of storing and downloading the entire dataset.

Open Access

This metadata is provided under the Creative Commons Attribution-NonCommercial 4.0 International License https://creativecommons.org/licenses/by-nc/4.0/). This license allows for unrestricted use, distribution, and reproduction in any medium, provided that proper credit is given to the original author(s) and the source. Furthermore, this license does not allow the use of this material for commercial purposes.

Acknowledgements

The authors express their gratitude for the support from the Engineering and Physical Sciences Research Council (EPSRC) of the United Kingdom under Grant No. EP/X019284/1, titled Aeroacoustics of Dynamic Stall


References

  1. Brooks, T.F., Pope, D.S. and Marcolini, M.A. (1989) Airfoil self-noise and prediction. NASA Reference Publication 1218. Hampton, VA: NASA Langley Research Center.
  1. McCroskey, W.J. (1981) The phenomenon of dynamic stall. NASA Technical Memorandum 81264. Moffett Field, CA: NASA Ames Research Center.
  1. Hadjipantelis, M., Masoudi, E., Zang, B. and Azarpeyvand, M. (2026) ‘Aerodynamics and aeroacoustics of dynamic stall of a pitching NACA 65-410 airfoil’, in 32nd AIAA/CEAS Aeroacoustics Conference. American Institute of Aeronautics and Astronautics. doi: 10.2514/6.2026-3469.DOI
  1. Masoudi, E., Zang, B., Azarpeyvand, M. (2026) ‘Experimental study of the aeroacoustic behavior of a pitching NACA65-410 airfoil’, Journal of Sound and Vibration, 621, 119494. DOI
  1. Mayer, Y.D., Zang, B., Azarpeyvand, M. (2020) ‘Aeroacoustic investigation of an oscillating airfoil in the pre- and post-stall regime’, Aerospace Science and Technology, 103, 105880. DOI
  1. Mayer, Y.D., Jawahar, H.K., Szőke, M., Ali, S.A.S., Azarpeyvand, M. (2019) ‘Design and performance of an aeroacoustic wind tunnel facility at the University of Bristol’, Applied Acoustics, 155, pp.358-370. DOI
  1. Devenport, W.J., Burdisso, R.A., Borgoltz, A., Ravetta, P.A., Barone, M.F., Brown, K.A. and Morton, M.A. (2013) ‘The Kevlar-walled anechoic wind tunnel’, Journal of Sound and Vibration, 332(17), pp. 3971–3991. DOI
  1. Mayer, Y.D. (2020). Aeroacoustic Characteristics of Static and Dynamic Stall. University of Bristol. PhD Thesis