Automotive DrivAer model – Fastback, Notchback, Estate back
 Martin A Passmore 1 ✉
Felix Wittmeier 2
Timo Kuthada 2
Martin A Passmore 1 ✉
Felix Wittmeier 2
Timo Kuthada 2
Affiliation : 1 Aeronautical and Automotive Engineering, Loughborough University, UK
2 Forschungsinstitut für Kraftfahrwesen und Fahrzeugmotoren Stuttgart (FKFS), 70569 Stuttgart, Germany;
✉ m.a.passmore@lboro.ac.uk; admin@nwtf.ac.uk
Introduction:
The urgency of reducing carbon dioxide emissions has placed immense pressure on the automotive industry to lower their environmental footprint. One of the remaining areas with significant potential for improvement is vehicle aerodynamics, which can lead to substantial economic benefits through drag reduction. Understanding the flow field around a typical car geometry is crucial to unlocking these savings.
Traditional studies often focus on simplified car models like the Ahmed body and the SAE model due to their extensive validation data. These models help isolate basic flow structures by minimizing interference effects, but they fall short in replicating the complex flow phenomena found in real vehicles, such as the flow around wheelhouses and the interaction between the car underbody and the road .
Advances in computational and experimental resources now allow for more detailed and realistic investigations without excessive cost. Therefore, here we have investigated the wake flow characterstics of the realistic car model, DrivAer. This model was developed at Technische Universität München, in collaboration with Audi AG and the BMW Group[1,2]. This realistic generic car model has been designed with three different rear geometries, Fastback, Notchback and Estate back.
In this work, a 25% scale model of the DrivAer automotive model with all three rear-end geometries was studied, and the model used was on loan from FKFS Stuttgart. One of the primary aims is to provide high-quality validation data, which is achieved through a comprehensive series of measurements, including forces, moments, pressures, and off-body PIV measurements for the three rear-end configurations. All results from these measurements can be found in Varney et al. [3], which offers a detailed description of the test conditions and wind tunnel setup, along with access to the full dataset.
Model geometry
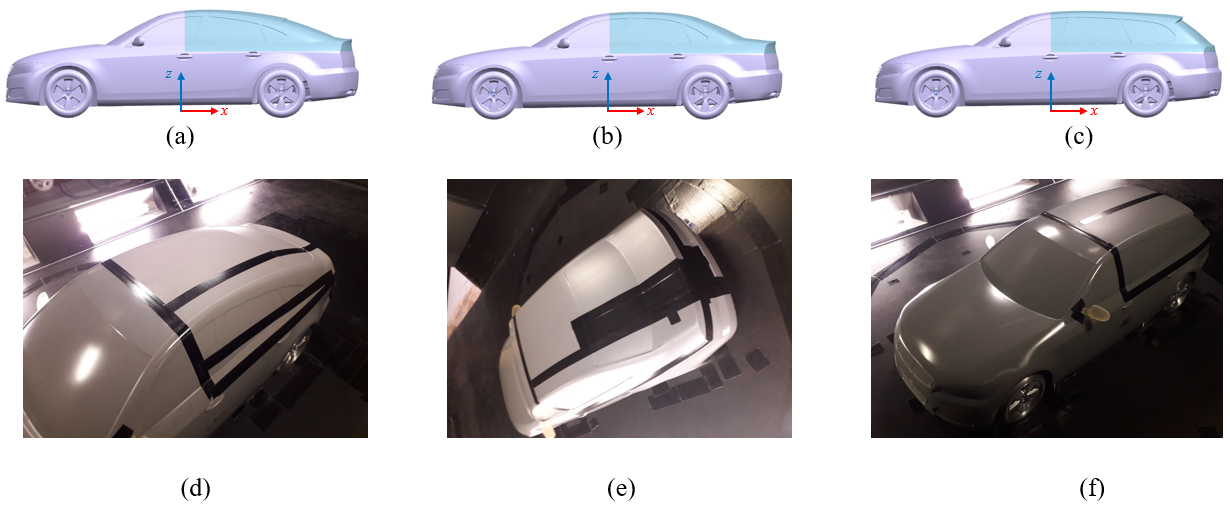
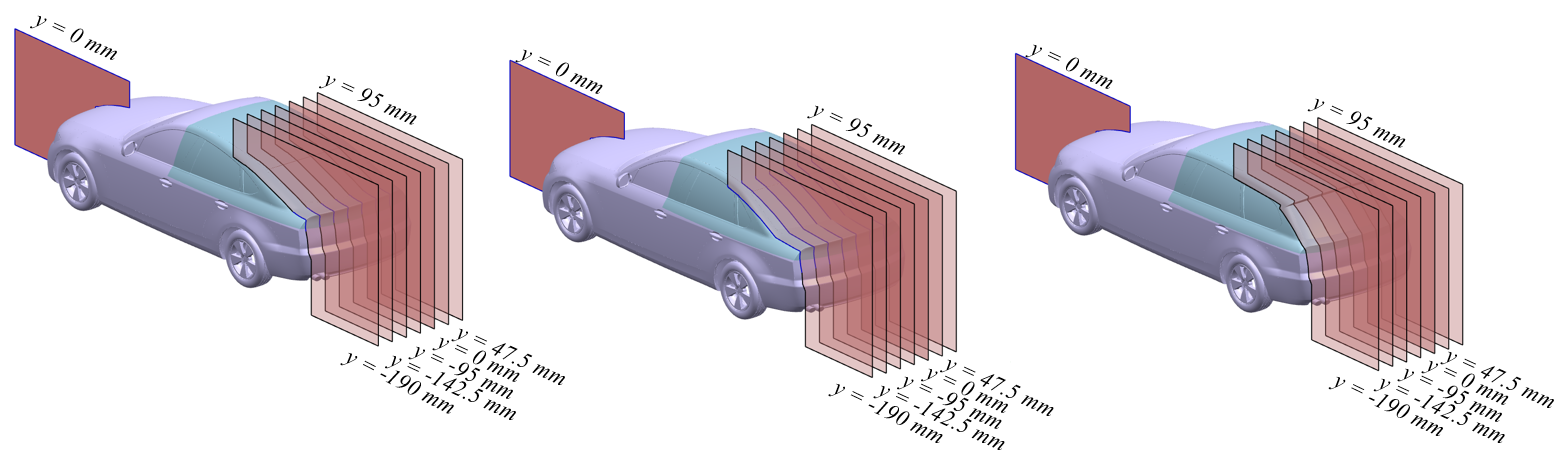
The standard model used for these measurements can be downloaded from the Technical University of Munich’s (TU Munich) website. This model was manufactured in four distinct parts: one core test vehicle with three interchangeable rear geometries. Each rear geometry was then mounted onto the core vehicle, resulting in three configurations: fastback, notchback, and estate back, shown in Figure 2. The origin of the coordiate system is positioned at mid-track, mid-wheelbase on the ground plane, illustrated in Figure 2, with xx positive downstream and zz positive up, using the right hand rule to find positive yy. To acheive the symmetric base pressure distribution, the model was yawed upto 0±\pm0.2 degrees. Considering the yawing, the model was also found to be laterally centred in the tunnel within 2 mm.
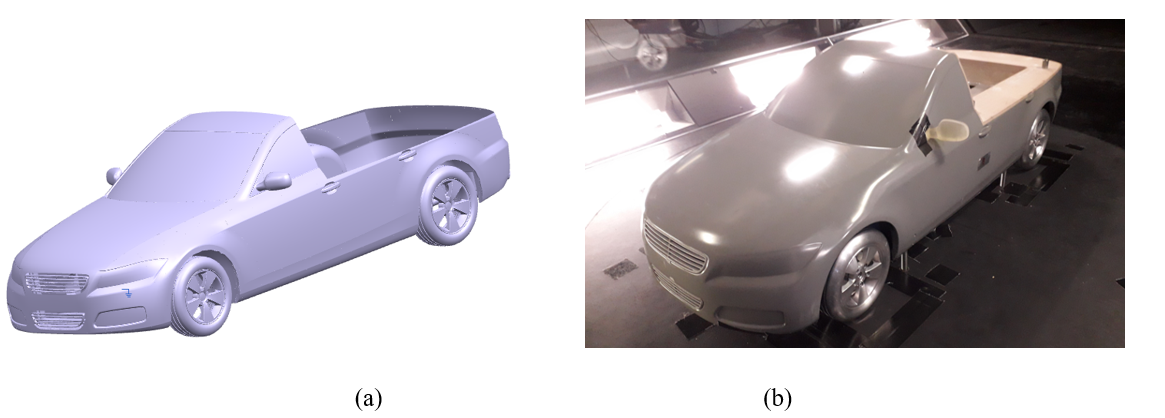
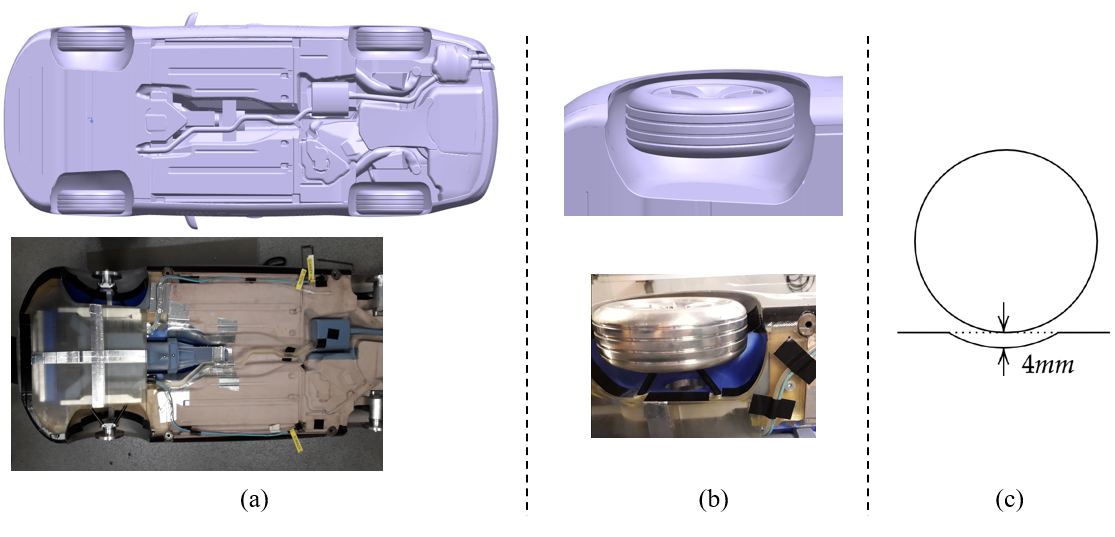
The original model developed at TU Munich includes several components, and the configuration studies here uses a detailed engine bay and cooling flow, a comprehensive underbody(Figure 3a), five-spoke wheels with tire tread (Figure 3b), and wing mirrors. The wheels on this model were designed to rotate with a moving ground plane. However, in the fixed floor configuration of the Loughborough University Large Wind Tunnel, they were prevented from rotating by securing them to the suspension. All four wheels were oriented as shown in Figure 1b, with a 4 mm clearance around the wheels in a precisely machined section of the floor, as illustrated in Figure 3c.
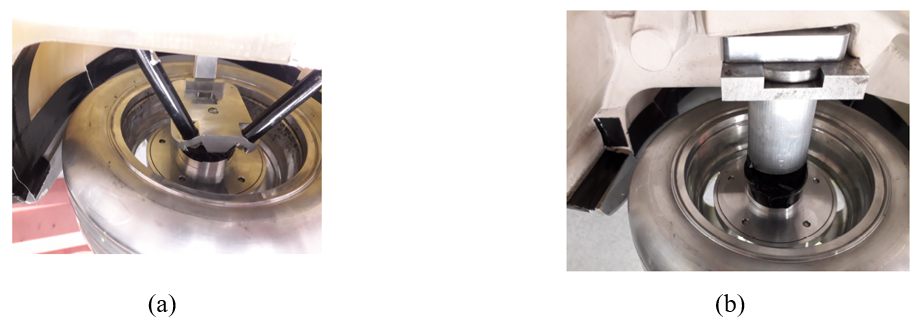
A significant deviation from the downloadable geometry involves the mounting of the wheels and radiator. The front wheels are mounted using components simulating a MacPherson strut (Figure 4a), and the rear wheels use a rigid axle (Figure 4b). The model’s ride height matches the downloadable CAD geometry, maintaining a distance of 172 ± 0.5 mm for the front wheel arches and 171 ± 0.5 mm for the rear wheel arches using steel mounting pins, can be noticed in Figure 1b.
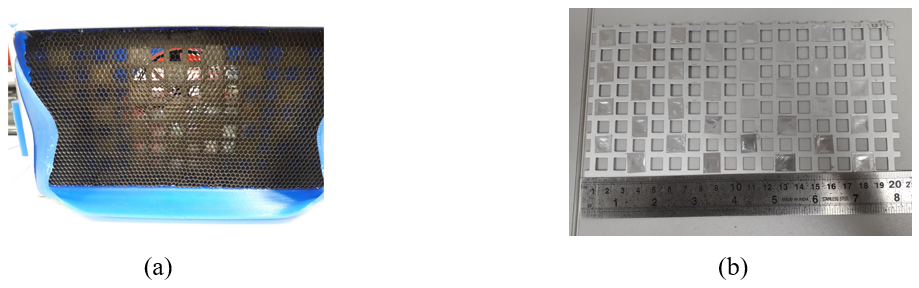
Additionally, a porous radiator was used, which is not available for download from the TU Munich website. The pressure drop across the radiator is simulated with hexagonal expanded aluminum honeycomb (Figure 5a) and a perforated sheet (Figure 5b). The honeycomb features 3 mm hexagonal cells with a 0.06 mm wall thickness and 10 mm depth, while the perforated sheet has 8 mm holes with 4 mm spacing and a depth of 0.6 mm, with 25% of the holes covered to increase the pressure drop, shown in Figure 5b.
Measurement Locations and Techniques
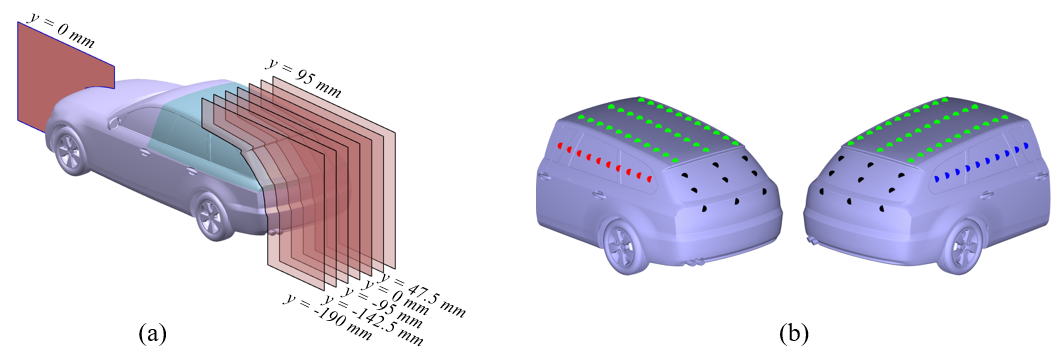
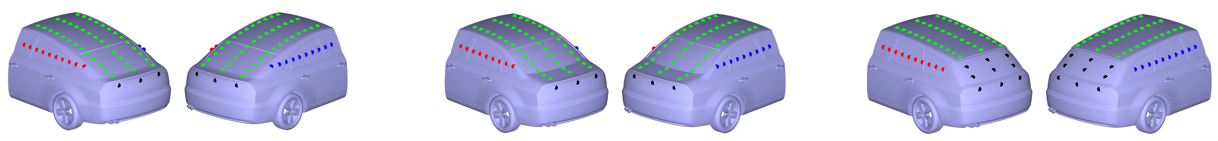
For all three rear geometry configurations, 2D PIV, force balance, and pressure measurements were conducted. PIV measurements were performed to characterize the wake flow field and stagnation region, and the measurements were carried out at various planes in the wake regime, as illustrated in Figure 6a. To facilitate pressure measurements, pressure ports were positioned at the rear geometry of the model, as shown in Figure 6b.
Experimental Facility
All tests were performed in the Loughborough University large wind tunnel, an open return tunnel with a 2.5 m2 rectangular closed working section and a static ground plane. The working section is 3.6 m long with cross section dimensions of 1.92 m x 1.3 m with 0.2 m chamfers in each of the corners, and a contraction ratio of 7.3:1.
Flow Conditions
Inlet velocity = 40 m/s.
Free-stream turbulence ≈\approx 0.2 %.
Reynolds number based on length of the model, ReL = 2.94 x 10⁶.
Flow uniformity = ±\pm0.4%.
2D PIV – All the measurements in yy and zz planes.
Time averaged drag coefficient
CD‾Fastback\overline{C_D}_{Fastback} : 0.311
CD‾Notchback\overline{C_D}_{Notchback} : 0.312
CD‾Estate back\overline{C_D}_{Estate\;back} : 0.334
The reference frontal area of the model used for the drag calcualtion is 0.136 m2.
Wind Tunnel Corrections
No corrections have been made to the data.
CAD files
The CAD geometry of the DrivAer model has not been duplicated for this dataset, instead the full scale model can be found at TU Munich website. For this experiment, the model was scaled down to 25% of its original size and then fabricated. Moreover, it includes the 5 spoke wheels, detailed underbody, wing mirrors, the drivetrain, an open front grill and a porous radiator.
The list of parts used to model the car is provided below, and it is named as specified in the original downloadable link:
01_Body_Open_EngineBayFlow
02_Underbody_EngineBayFlow
05_Wheels_Front
06_Wheels_Rear
07_Mirrors
09_EngineAndGearbox_EngineBayFlow
10_FrontGrills_EngineBayFlow
Available Datasets:
(i) Mean flow field
| Fastback (Wake regime) |
|---|
| y = 95 mm.csv |
| y = 47.5 mm.csv |
| y = 0 mm.csv |
| y = -47.5 mm.csv |
| y = -95 mm.csv |
| y = -142.5 mm.csv |
| y = -190 mm.csv |
| Notchback (Wake regime) |
|---|
| y = 95 mm.csv |
| y = 47.5 mm.csv |
| y = 0 mm.csv |
| y = -47.5 mm.csv |
| y = -95 mm.csv |
| y = -142.5 mm.csv |
| y = -190 mm.csv |
| Estate back (Wake regime) |
|---|
| y = 95 mm.csv |
| y = 47.5 mm.csv |
| y = 0 mm.csv |
| y = -47.5 mm.csv |
| y = -95 mm.csv |
| y = -142.5 mm.csv |
| y = -190 mm.csv |
| Fastback (Stagnation regime) |
|---|
| y = 0 mm.csv |
| Notchback (Stagnation regime) |
|---|
| y = 0 mm.csv |
| Estate back (Stagnation regime) |
|---|
| y = 0 mm.csv |
(ii) Pressure measurement
As there are eight PIV measurement planes for each model configuration, there are also eight sets
of accompanying pressure data.
| Estate back |
|---|
| Pressure tapping map.csv |
| Mean pressure data.csv |
(iii) Force measurement
As there are eight PIV measurement planes for each model configuration, there are also eight sets
of accompanying force data.
Open Access
This metadata is provided under the Creative Commons Attribution-NonCommercial 4.0 International License https://creativecommons.org/licenses/by-nc/4.0/). This license allows for unrestricted use, distribution, and reproduction in any medium, provided that proper credit is given to the original author(s) and the source. Also provide a link to the license, and indicate if any changes were made. Furthermore, this license does not allow the use of this material for commercial purposes.
Acknowledgments
The NWTF acknowledge the support for the metadata work from the EPSRC Network Grant, EP/X011836/1.
References
- Heft, A., Indinger, T. and Adams, N., 2011. Investigation of unsteady flow structures in the wake of a realistic generic car model. In 29th AIAA applied aerodynamics conference (p. 3669). DOI
- Heft, A.I., Indinger, T. and Adams, N.A., 2012. Experimental and numerical investigation of the DrivAer model. In Fluids Engineering Division Summer Meeting (Vol. 44755, pp. 41-51). American Society of Mechanical Engineers.DOI
- Varney, M., Passmore, M., Wittmeier, F. and Kuthada, T., 2020. Experimental data for the validation of numerical methods: DrivAer model. Fluids, 5(4), p.236. DOI