
Time-Resolved PIV of Stalled NACA 0012 and NACA 65-410 Aerofoils
 Bharathram Ganapathisubramani
✉
Affiliation : Department of Aeronautics and Astronautics, University of Southampton, United Kingdom.
✉ G.Bharath@soton.ac.uk
Introduction
The flow around aerodynamic bodies, such as aircraft wings and road vehicles, is characterised by complex pressure distributions that influence aerodynamic forces, flow separation, and noise generation. Understanding these pressure variations is essential for improving aerodynamic performance and investigating unsteady flow phenomena. Particle Image Velocimetry (PIV) provides a non-intrusive technique for measuring spatially resolved velocity fields, enabling detailed investigation of flow structures and turbulent motion[1].
Pressure fields can be reconstructed from PIV velocity measurements by applying the governing equations of fluid motion. Previous studies have demonstrated the feasibility of estimating instantaneous pressure distributions from experimentally measured velocity fields[2]. The development of PIV-based pressure reconstruction techniques has further enabled the investigation of unsteady pressure fluctuations in complex flows, including separated and turbulent flow regions[3].
This dataset presents experimental velocity and reconstructed pressure fields around two aerofoil geometries: the symmetric NACA 0012 and the cambered NACA 65-410, at a chord-based Reynolds number of approximately 7.1 × 10⁴. The measurements cover attached flow, transient stall, and deep-stall conditions, providing insight into flow separation, shear-layer development, and unsteady wake structures. The dataset supports aerodynamic analysis, numerical validation, and the investigation of reduced-order flow modelling and pressure-based flow-state estimation.
The experimental methodology, flow characteristics, and detailed analysis are presented in Carter and Ganapathisubramani[4].
Model Geometry
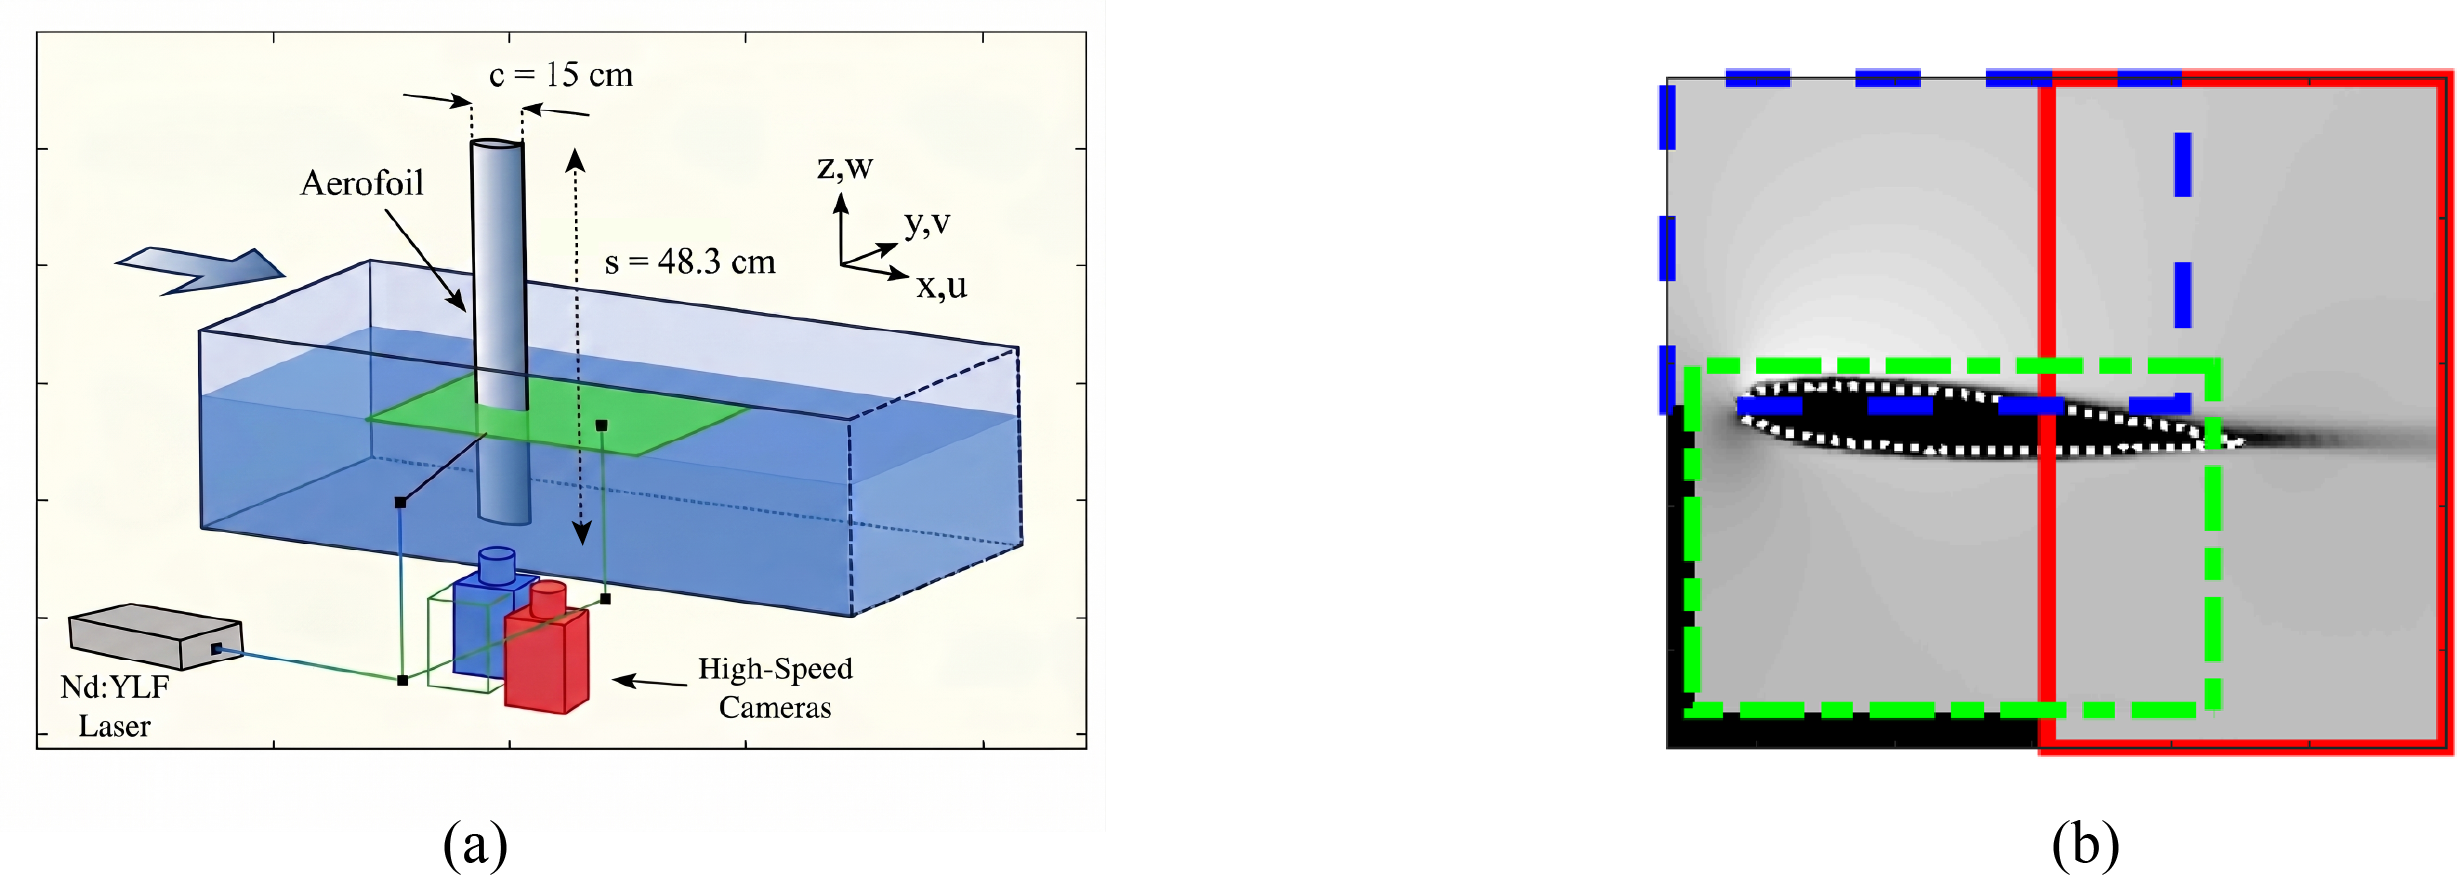
Two aerofoil geometries were investigated: the symmetric NACA 0012 and the cambered NACA 65-410. Both models had a chord length of 0.15 m and a total span of 0.70 m, of which 0.483 m was submerged in the water. The aerofoils were mounted vertically at the centre of the water-flume test section, immediately downstream of the contraction.
The measurement plane was aligned in the streamwise and surface-normal directions at the aerofoil mid-span. The measurement domain encompassed the suction-side, pressure-side, and trailing-edge regions of the aerofoils. Due to optical access limitations, a small region adjacent to the pressure-side surface was obscured and subsequently masked in the measured velocity fields.
The angle of attack was precisely controlled using an overhead carriage system, allowing the flow characteristics to be investigated under different aerodynamic conditions. The dataset includes measurements for the NACA 0012 at 4°, 13°, and 15°, representing attached flow, transient stall, and deep stall, respectively, and the NACA 65-410 at 15.5° and 17°, both corresponding to deep-stall conditions.
These configurations enable the investigation of flow separation, shear-layer development, and wake characteristics across symmetric and cambered aerofoil geometries under different stall conditions.
Measurement Location and Techniques
The flow field was measured using time-resolved Particle Image Velocimetry (PIV) in the University of Southampton water-flume facility. Measurements were conducted in the streamwise and surface-normal (x–y) plane at the mid-span of the vertically mounted aerofoils. The measurement domain encompassed the suction-side, pressure-side, and trailing-edge regions, enabling the investigation of flow separation, shear-layer development, and wake dynamics under different stall conditions.
The flow was illuminated using laser sheets directed from both sides of the test section, while three synchronised high-speed cameras captured the suction-side, pressure-side, and trailing-edge regions of the aerofoil. The flow was seeded with tracer particles to enable planar velocity measurements.
The individual camera fields of view were combined into a continuous measurement domain using calibration images and overlapping reference regions. Geometric distortions were corrected during calibration, and the velocity fields were stitched together using a Hamming-window blending technique. To maintain spatial consistency, the higher-resolution suction-side and pressure-side velocity fields were interpolated onto the lower-resolution trailing-edge grid. Due to optical occlusion caused by the aerofoil geometry and camera viewing angles, a small region adjacent to the pressure-side surface was masked during processing.
The resulting time-resolved planar velocity fields were used to characterise the flow structures and reconstruct the corresponding pressure fields for subsequent aerodynamic analysis.
Experimental Facility
The experiments were conducted in a water-flume facility at the University of Southampton, featuring a test section 6.75 m long, 1.2 m wide, and a water depth of 0.5 m. The aerofoil models were mounted vertically at the centre of the flume, immediately downstream of the contraction section.
The experiments were performed at a freestream velocity of approximately 0.5 m/s, corresponding to a chord-based Reynolds number of 7.1 × 10⁴. The freestream velocity was independently monitored using a flowmeter positioned at the mid-span of the flume, sufficiently downstream of the model to avoid interference from its wake.
The facility provided optical access for time-resolved Particle Image Velocimetry (PIV) measurements around the aerofoil. An overhead carriage system enabled precise adjustment of the angle of attack, while a six-axis force/torque sensor mounted to the aerofoil allowed simultaneous measurement of aerodynamic forces. The force measurements were synchronised with the PIV acquisition to investigate the relationship between unsteady flow structures and aerodynamic loading.
Flow Conditions
- Working fluid = Water
- Freestream velocity (U∞) = 0.5366 m/s
- Chord-based Reynolds number (Rec) ≈ 7.1 × 10⁴
- Angle of attack (AOA):
- NACA 0012 = 4°, 13°, and 15°
- NACA 65-410 = 15.5° and 17°
- Flow regimes = Attached flow, transient stall, and deep stall
- Kinematic viscosity (ν) ≈ 1 × 10⁻⁶ m2/s
- Measurement duration per case ≈ 26.84 s (five repeated recordings)
- Sampling frequency = 1 kHz
- Temporal low-pass filtering cutoff = 10 Hz
- Non-dimensional frequency (f*) = fc/U∞
- Frequency range analysed = f* ≤ 3
CAD files (2D Aerofoil profiles)
NACA 0012 profile NACA 65-410 profile
Available Datasets
Velocity Measurements
| Aerofoil | AOA | U mean | V mean | U variance | V variance |
|---|---|---|---|---|---|
| NACA 0012 | 4° | U_mean_4AOA.csv | V_mean_4AOA.csv | U_Var_4AOA.csv | V_Var_4AOA.csv |
| NACA 0012 | 13° | U_mean_13AOA.csv | V_mean_13AOA.csv | U_Var_13AOA.csv | V_Var_13AOA.csv |
| NACA 0012 | 15° | U_mean_15AOA.csv | V_mean_15AOA.csv | U_Var_15AOA.csv | V_Var_15AOA.csv |
| NACA 65-410 | 15.5° | U_mean_15p5AOA.csv | V_mean_15p5AOA.csv | U_Var_15p5AOA.csv | V_Var_15p5AOA.csv |
| NACA 65-410 | 17° | U_mean_17AOA.csv | V_mean_17AOA.csv | U_Var_17AOA.csv | V_Var_17AOA.csv |
Pressure Measurements
| Aerofoil | AOA | P mean | P variance | P RANS |
|---|---|---|---|---|
| NACA 0012 | 4° | P_mean_4AOA.csv | P_var_4AOA.csv | P_RANS_4AOA.csv |
| NACA 0012 | 13° | P_mean_13AOA.csv | P_var_13AOA.csv | P_RANS_13AOA.csv |
| NACA 0012 | 15° | P_mean_15AOA.csv | P_var_15AOA.csv | P_RANS_15AOA.csv |
| NACA 65-410 | 15.5° | P_mean_15p5AOA.csv | P_var_15p5AOA.csv | P_RANS_15p5AOA.csv |
| NACA 65-410 | 17° | P_mean_17AOA.csv | P_var_17AOA.csv | P_RANS_17AOA.csv |
POD and Coordinates
| Aerofoil | AOA | POD Data | Coordinates |
|---|---|---|---|
| NACA 0012 | 4° | POD_NACA0012_4AOA.mat | PIV- xy- NACA0012_4AOA.mat |
| NACA 0012 | 13° | POD_NACA0012_13AOA.mat | PIV- xy- NACA0012_13AOA.mat |
| NACA 0012 | 15° | POD_NACA0012_15AOA.mat | PIV- xy- NACA0012_15AOA.mat |
| NACA 65-410 | 15.5° | POD_NACA65410_15p5AOA.mat | PIV- xy- NACA65410_15p5AOA.mat |
| NACA 65-410 | 17° | POD_NACA65410_17AOA.mat | PIV- xy- NACA65410_17AOA.mat |
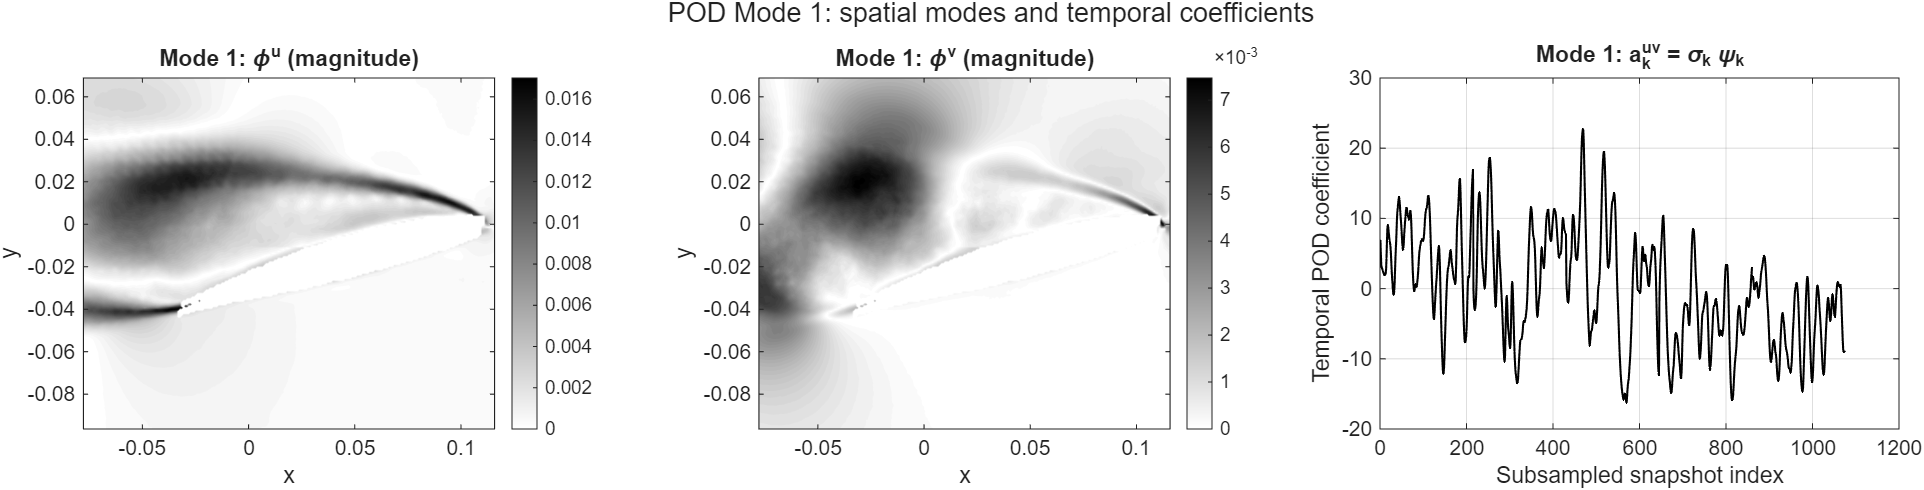
The Proper Orthogonal Decomposition (POD) datasets are provided in MATLAB .mat format and contain spatial POD modes, temporal coefficients, and singular values derived from the time-resolved velocity and reconstructed pressure fields. These data enable the identification and analysis of dominant coherent flow structures associated with flow separation, shear-layer dynamics, and vortex shedding. The corresponding spatial coordinates are also provided for visualisation.
A sample MATLAB script is provided to help users load the .mat files, select individual POD modes, and visualise their spatial distributions. The script enables users to explore the dominant flow structures without developing their own post-processing routines.
Complete Dataset Archive (ZIP)
The complete original dataset is available here for download and contains both raw and mean measurement data. The original dataset was created and archived by the researchers and it may not be organised in a standardised format. The metadata presented here has been extracted and systematically structured from the original dataset to improve its accessibility, and usability.
Sample plots
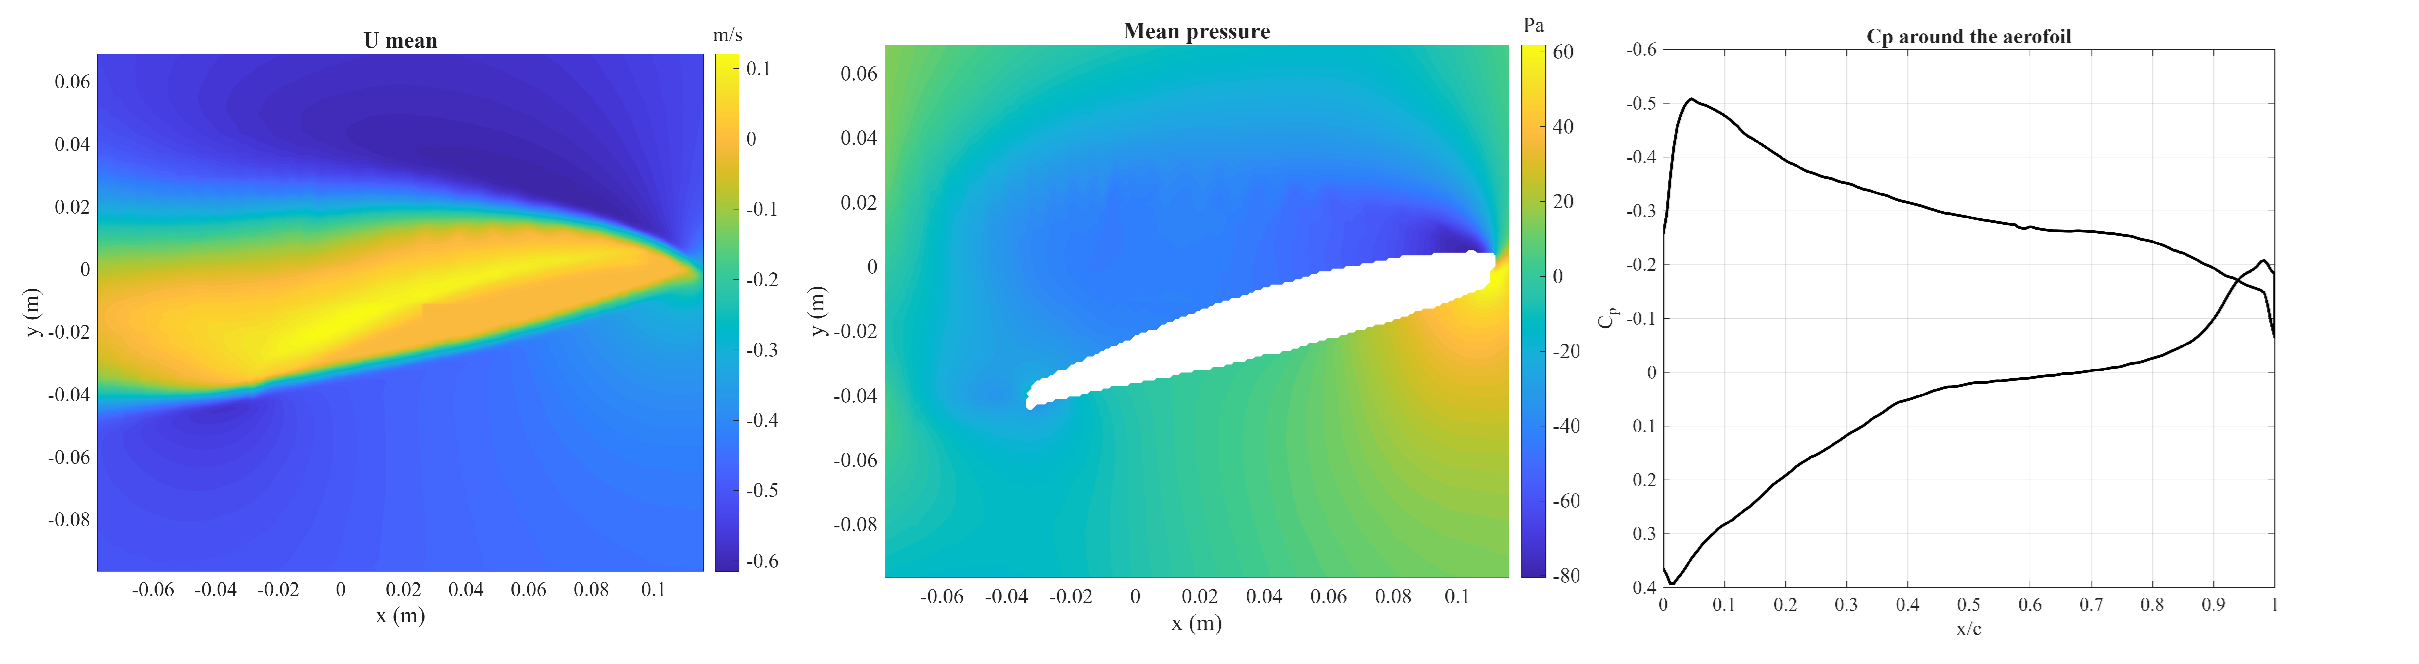
To help you analyze the dataset, a MATLAB script for pressure and velocity , MATLAB script for POD has been provided. This script can be used to automatically create the colour maps of Mean velocity, pressure and coefficient of pressure. The sample plots using the matlab code is given in figure 2 and figure 3.
Open Access
This metadata is provided under the Creative Commons Attribution-NonCommercial 4.0 International License (https://creativecommons.org/licenses/by-nc/4.0/). This license allows for unrestricted use, distribution, and reproduction in any medium, provided that proper credit is given to the original author(s) and the source. Also provide a link to the license, and indicate if any changes were made. Furthermore, this license does not allow the use of this material for commercial purposes.
Acknowledgments
The NWTF acknowledge the support for the metadata work from the EPSRC Network Grant, EP/X011836/1. The original dataset was funded by the Engineering and Physical Sciences Research Council (Ref No: EP/R010900/1) and H2020 Future and Emerging Technologies Project HOMER 769237
Citation
If the user wants to cite the data presented here, then please cite both the NWTF metadata and the corresponding paper[4].
References
- Adrian, R.J., 1991. Particle-imaging techniques for experimental fluid mechanics. Annual Review of Fluid Mechanics, 23(1), pp.261-304. DOI
- de Kat, R. and van Oudheusden, B.W., 2012. Instantaneous planar pressure determination from PIV in turbulent flow. Experiments in Fluids, 52(5), pp.1089-1106. DOI
- van Oudheusden, B.W., 2013. PIV-based pressure measurement. Measurement Science and Technology, 24(3), p.032001. DOI
- Carter, D.W. and Ganapathisubramani, B., 2023. Low-order modeling and sensor-based prediction of stalled airfoils at moderate Reynolds number. AIAA Journal, 61(7), pp.2893-2905. DOI


