Two-Bladed Propeller Performance in Inclined Flow
 Richard Green ✉
Affiliation : University of Glasgow, University Avenue, G12 8QQ, Glasgow, Scotland, UK
✉ Richard.Green@glasgow.ac.uk; admin@nwtf.ac.uk
Introduction:
Propellers offer a unique advantage in aircraft propulsion at speeds up to Mach 0.8[1], often outperforming other systems. Despite this, civil aviation in the Mach 0.6–0.8 range has historically relied on turbofans. This preference is due to several factors: the technical challenges of managing compressibility effects on propellers, limited emissions regulations in the past, and the long-standing availability of affordable fossil fuels. However, recent shifts in the industry are bringing propellers back into focus. Advances in high-speed propeller blade designs have helped address earlier technical barriers, while growing emphasis on reducing emissions and improving fuel efficiency has made propellers increasingly attractive.
Research on propeller behavior, however, has remained somewhat fragmented. A key gap exists in understanding how propellers perform when exposed to inclined airflow, an essential aspect for accurate aerodynamic modeling. Most of the experimental data on this topic is outdated, derived from studies conducted mainly in the first half of the 20th century. Early research focused on basic aerodynamic forces and stability effects but lacked the precision and detail needed for comprehensive modeling[2][3][4]. Later studies explored specific phenomena like force oscillations and wake composition using strain gauges and pressure rakes but still offered limited insights due to low temporal and spatial resolution.
This work aims to address these gaps by focusing on propeller inflow, which includes both induced and incident flow components. Induced flow refers to the airflow changes caused by the propeller’s thrust generation, while incident flow represents the natural airflow environment around the propeller. Accurate modeling of both components is crucial, especially for low-order models that simplify flow characteristics for computational efficiency. Many widely used models today still rely on assumptions established decades ago, reflecting limitations in high-quality experimental data and computational power. This study seeks to improve our understanding of propeller inflow dynamics, providing essential data to refine these foundational models. All results from these measurements can be found in Zarev and Green (2020). [5], which offers a detailed description of the test conditions and wind tunnel setup, along with access to the full dataset.
Model geometry
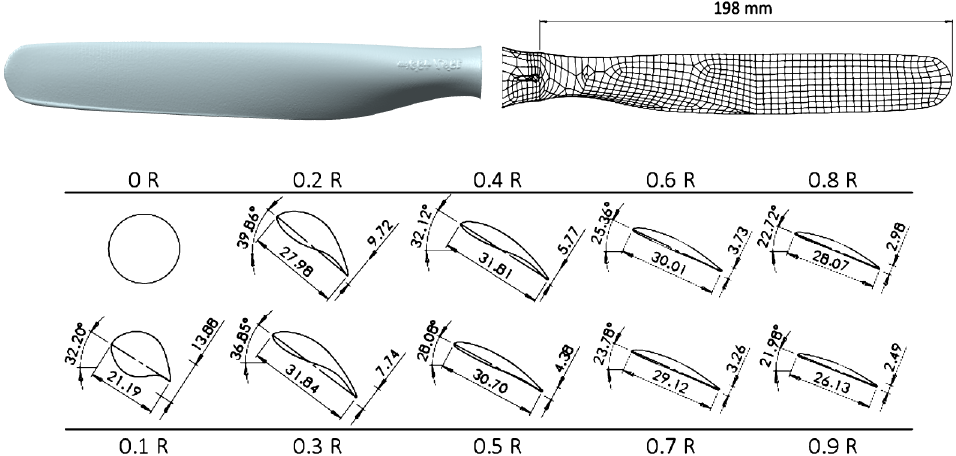
The specifications of the propeller blade are shown in Figure. 1. The hub is rigid and non-articulated, with a total diameter, including the propellers, of 0.499 m. The rig is powered by a Panasonic MSMA082A1C 750W AC servo motor, coupled with a programmable driver. The motor operates at a rated maximum continuous frequency of 3000 revolutions per minute, with a rated torque of 2.4 Nm and a peak torque of 7.15 Nm.
During testing, the motor’s rotational speed ranged from 40 revolutions per second (for the highest advance ratio, JJ) to 50 revolutions per second (for the lowest JJ). The advance ratio is given by J=V∞nDJ = \frac{V_\infty}{nD}, where V∞V_\infty is the free-stream velocity, nn is the rotational speed, and DD is the propeller diameter. To minimize the effects of wind tunnel interactions and installation influences, each data set was measured twice: once with the propellers installed on the hub, and once without them. In the latter case, the blade installation cavities were plugged to ensure identical conditions for comparison.
Measurement Locations and Techniques
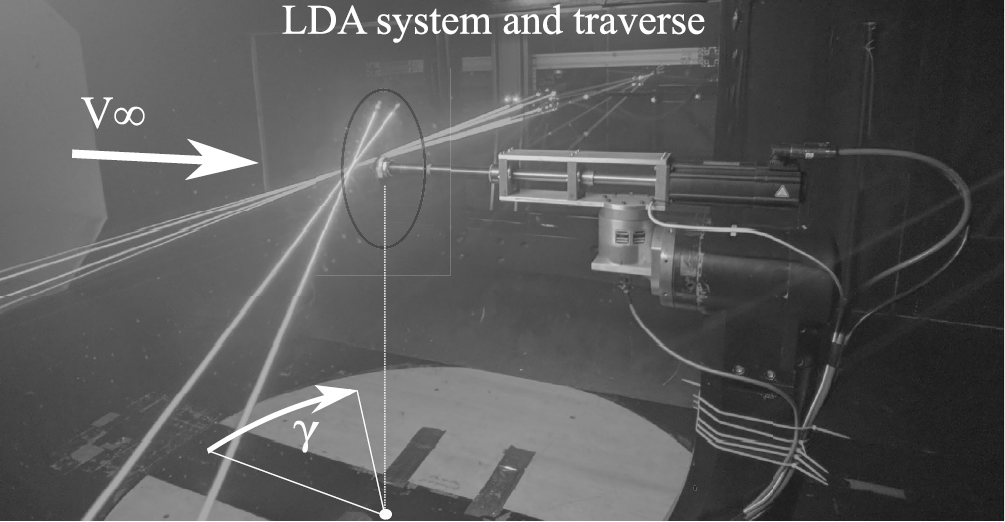
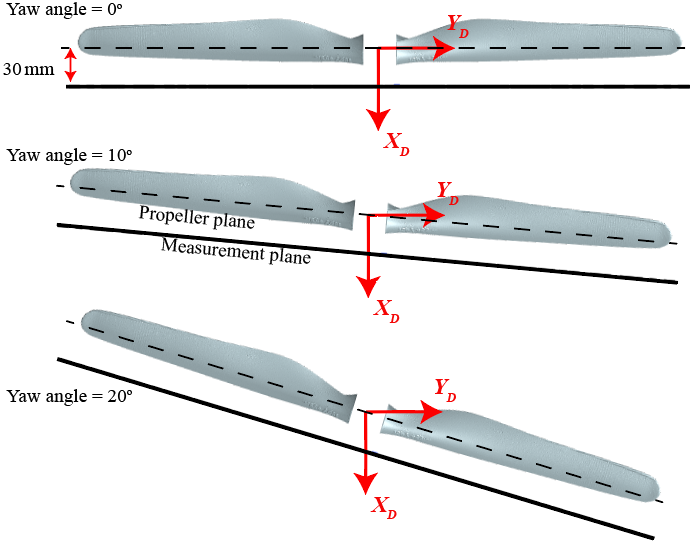
An experimental study was conducted to measure the inflow into a two-bladed propeller across various advance ratios and yaw angles, covering 25 distinct cases and 50 runs. All tests were conducted at a Reynolds number of 110800±\pm400 calculated using the chord length and the resultant velocity at the 0.7R position of the advancing blade. Measurements were taken using a Dantec Dynamics three-component Laser Doppler Anemometry (LDA) system, positioned 30 mm upstream of the hub and propeller center. The LDA system traverse is positioned on the starboard side of the working section when facing the airflow, with the coordinate system defined in streamwise, lateral and vertical direction as XD,YDX_D, Y_D and ZDZ_D respectively .
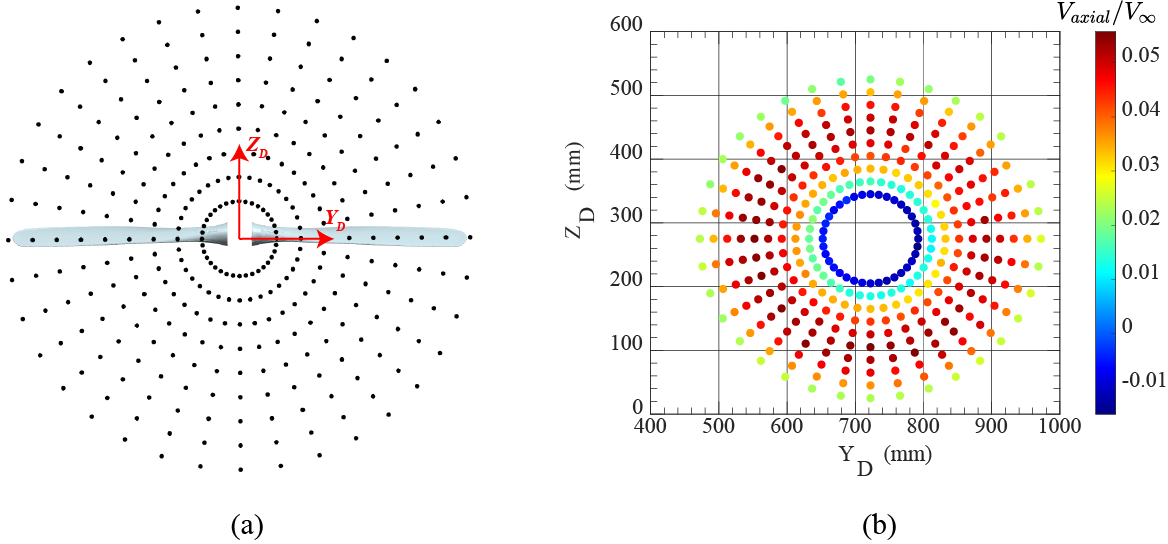
The measurement distance was selected as the minimal distance to the propeller plane that still allowed laser access across the entire grid. The measurement plane was aligned with the propeller plane, both axially and laterally, as shown in Figure 2. The experimental plane was defined by a coordinate grid of 360 points, consisting of 36 azimuthal and 10 radial positions, schematically shown in Figure 3. Each point was sampled for 3 seconds to ensure reliable data collection.
Experimental Facility
All tests were performed in the University of Glasgow De Havilland wind tunnel facility. The wind tunnel’s settling chamber to test section contraction ratio is 5:1, and the working section has an octagonal cross section of 2.74 m width, 2.1 m height, and 5 m length with a contraction ratio of 5:1. It can provide a maximum free-stream velocity of 70 m/s with good flow uniformity (turbulence intensity levels under 0.2%).
Flow Conditions
Inlet velocity = 9, 15, 20, 27, 30 m/s.
Yaw angle = 12o,20o,28o,42o,49o
Free-stream turbulence ≈\approx 0.2 %.
Propeller radius (R) = 0.499/2 = 0.2495m
Reynolds number, Re0.7 = 110800 ±\pm 400, based on the chord length and advancing blade resultant velocity at the 70% spanwise position.
Flow uniformity = ±\pm0.4%.
LDA – All the measurements were taken in a plane parallel to the propeller plane.
Wind Tunnel Corrections
No corrections have been made to the data.
CAD files
The scanned model of the propeller in .stl file format is provided,
Propeller.stl.
Available Datasets:
(i) Mean flow field -interpolated data
The mean velocities obtained from the LDA (Laser Doppler Anemometry) measurements were interpolated to create a smooth flow field. These processed data are provided as .csv files for each yaw angle. Each file contains seven columns with the following data:
- XD/RX_{D}/R (normalized streamwise position),
- YD/RY_{D}/R (normalized spanwise position),
- U/U∞U/U_{\infty} (normalized streamwise velocity),
- V/U∞V/U_{\infty} (normalized vertical velocity),
- W/U∞W/U_{\infty} (normalized lateral velocity),
- Radial velocity /U∞/U_{\infty},
- Tangential velocity /U∞/U_{\infty}.
Each column in the .csv files represents a square matrix, which can be reshaped into a 1001×10011001 \times 1001 matrix for plotting. Here is the matlab script that automatically reshapes the data and generates the colormap plots.
| Free-stream Velocity (m/s) | Pitch (degree) | Yaw angle (degree) | |||||
|---|---|---|---|---|---|---|---|
| 9 | 12o | 5o (.csv) | 10o (.csv) | 15o (.csv) | 20o (.csv) | ||
| 15 | 20o | 0o (.csv) | 5o (.csv) | 10o (.csv) | 15o (.csv) | 20o (.csv) | |
| 20 | 28o | 0o (.csv) | 5o (.csv) | 10o (.csv) | 15o (.csv) | 20o (.csv) | |
| 27 | 42o | 0o (.csv) | 5o (.csv) | 10o (.csv) | 15o (.csv) | 20o (.csv) | |
| 30 | 49o | 0o (.csv) | 10o (.csv) | 15o (.csv) | 20o (.csv) | ||
(ii) Mean flow field – uninterpolated data
The mean velocities obtained from the LDA (Laser Doppler Anemometry) measurements are provided directly in the .csv files below, without interpolation. Each file contains six columns:
- xDx_D (mm),
- yDy_D (mm),
- zDz_D (mm),
- U/U∞U/U_{\infty} (normalized streamwise velocity),
- V/U∞V/U_{\infty} (normalized vertical velocity),
- W/U∞W/U_{\infty} (normalized lateral velocity).
Here is the another MATLAB script can be used to plot the below data efficiently.
| Free-stream Velocity (m/s) | Pitch (degree) | Yaw angle (degree) | |||||
|---|---|---|---|---|---|---|---|
| 9 | 12o | 5o (.csv) | 10o (.csv) | 15o (.csv) | 20o (.csv) | ||
| 15 | 20o | 0o (.csv) | 5o (.csv) | 10o (.csv) | 15o (.csv) | 20o (.csv) | |
| 20 | 28o | 0o (.csv) | 5o (.csv) | 10o (.csv) | 15o (.csv) | 20o(.csv) | |
| 27 | 42o | 0o (.csv) | 5o (.csv) | 10o (.csv) | 15o (.csv) | 20o (.csv) | |
| 30 | 49o | 0o (.csv) | 10o (.csv) | 15o (.csv) | 20o (.csv) | ||
Open Access
This metadata is provided under the Creative Commons Attribution-NonCommercial 4.0 International License https://creativecommons.org/licenses/by-nc/4.0/). This license allows for unrestricted use, distribution, and reproduction in any medium, provided that proper credit is given to the original author(s) and the source. Also provide a link to the license, and indicate if any changes were made. Furthermore, this license does not allow the use of this material for commercial purposes.
Acknowledgments
The NWTF acknowledge the support for the metadata work from the EPSRC Network Grant, EP/X011836/1. The original dataset was funded by the EPSRC National Wind Tunnel Facility project EP/L024888/1 and supported by the Aircraft Research Association.
References
- Mitchell, G. and Mikkelson, D., 1982, June. Summary and recent results from the NASA advanced high-speed propeller research program. In 18th Joint Propulsion Conference (p. 1119). DOI
- W. Durand, E. Lesley, Tests on air propellers in yaw, NACA TR 113, 1923. URL
- O. Flachsbart, G. Krober, Experimental investigation of aircraft propellers ex-posed to oblique air currents, NACA TM 562, 1930. URL
- H.B. Freeman, The effect of small angles of Yaw and Pitch on the characteristics of airplane propellers, NACA TR 389, 1932. URL
- Zarev, A. and Green, R., 2020. Experimental investigation of the effect of yaw angle on the inflow of a two-bladed propeller. Aerospace Science and Technology, 103, p.105940. URL